Learn the six-level data quality maturity model that maps your organization's path from ad hoc fixes to proactive AI-augmented governance.
Table of Contents
Like this article?
Follow our monthly digest to get more educational content like this.

A data quality maturity model helps organizations move from reacting to problems as they happen to managing data quality in a planned way. It outlines the steps that teams take to build better data quality processes.
Unfortunately, teams sometimes rush to buy tools before they know what they really need or where they stand, which can lead to wasted time and money. To avoid this problem, well-known models like CMMI, DAMA, and Gartner use multiple stages that focus on formal governance.
In this article, we explore a six-level model reflecting recent shifts in AI-driven automation and data observability. We explain the difference between data observability and data quality, cover AI-driven automated checks, and show how organizations move from relying on automation alone (without sufficient human input into what “good” looks like) to having domain experts govern and refine what the automation produces.
Summary of data maturity stages
Level 0: No formal data quality
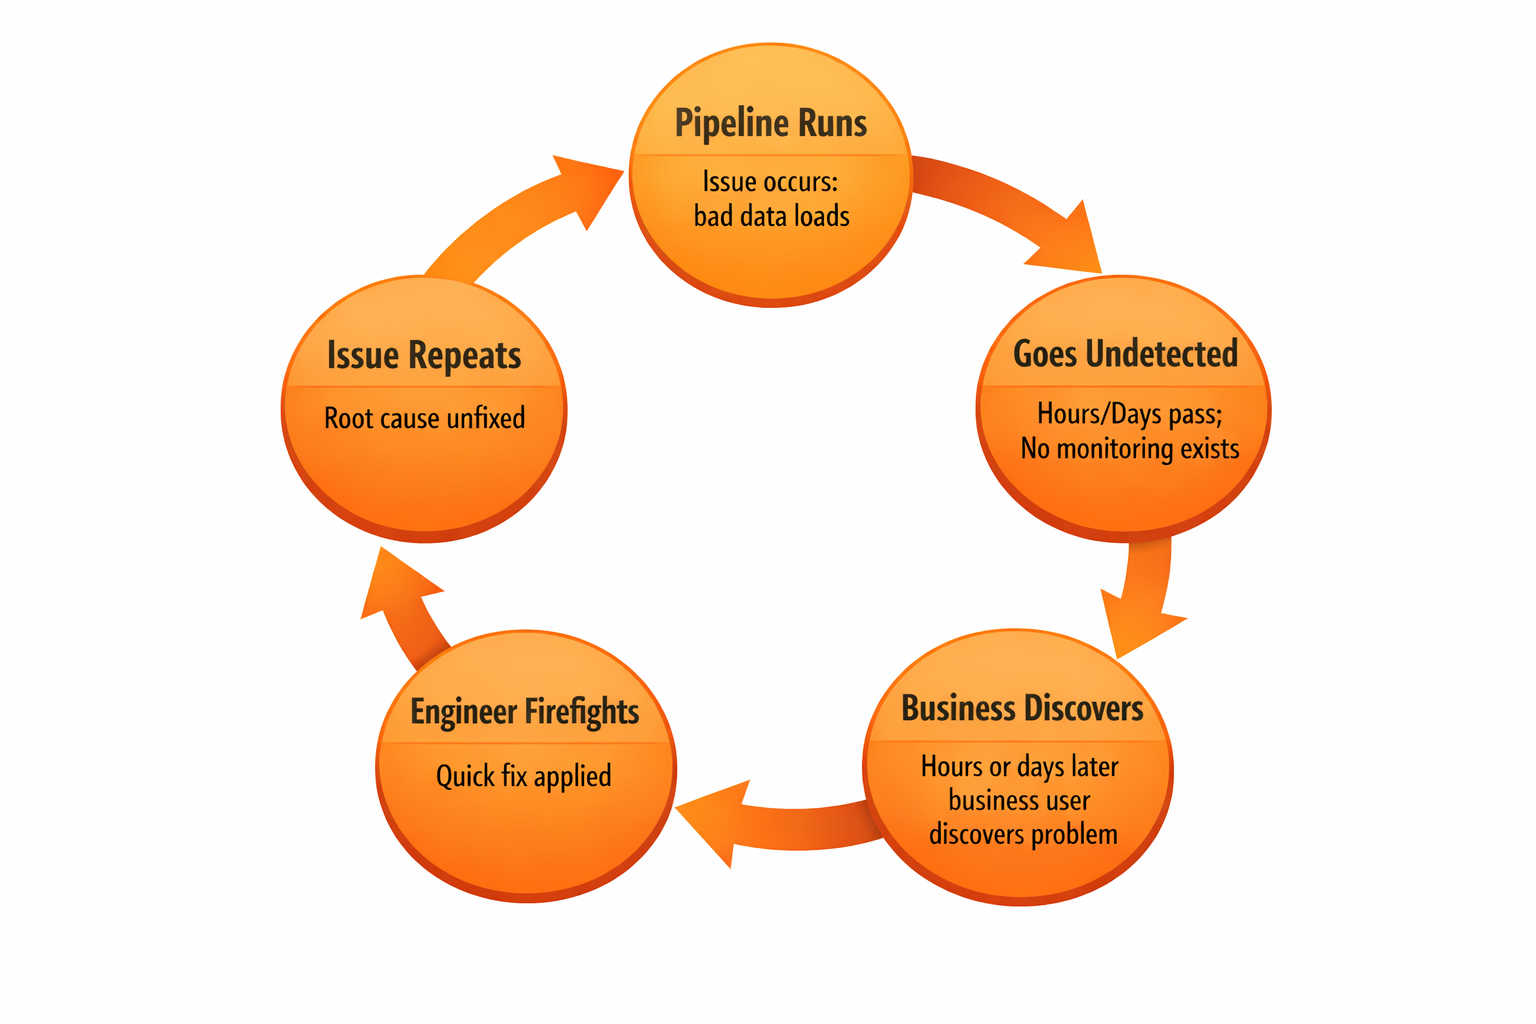
At this stage, teams only find out about data quality problems after they have hurt the business. For instance, a sales dashboard might show negative revenue for the fourth quarter because of an issue that wasn't found, or a customer might be charged twice. Executives might also make choices based on wrong information.
Occasionally a one-off check gets added after an incident, but there is no systematic monitoring or prevention. Engineers spend their time reacting to urgent issues and support tickets. If there is time, they look for the root cause, but the same problems keep coming back. Business users lose trust and create their own workarounds, while engineers are stuck fixing data quality issues instead of building new features. Leaders can't tell if problems are one-off or part of a bigger pattern. Often, the need for change becomes clear only after major failures, audits, or expensive mistakes.
To move to Level 1, start by recognizing the problems with the goal of catching them before customers notice. Write down the issues you find, identify your most important data assets, and add simple validation checks for key pipelines (such as using basic SQL to catch missing values or negative amounts). Assign someone to be responsible for each area.
{{banner-large-1="/banners"}}
Level 1: Distributed data quality
At this level, teams have started writing data quality checks, but each team works independently with no coordination. There is no shared inventory, no common standards, and no organization-wide view of data health. For example, your engineers write checks (e.g., SQL queries in dbt, custom scripts). Each team manages data quality in its own way.
The diagram below illustrates three teams independently checking the same customer data with overlapping coverage (email checked twice) and gaps (address unchecked). No one knows what others are doing.
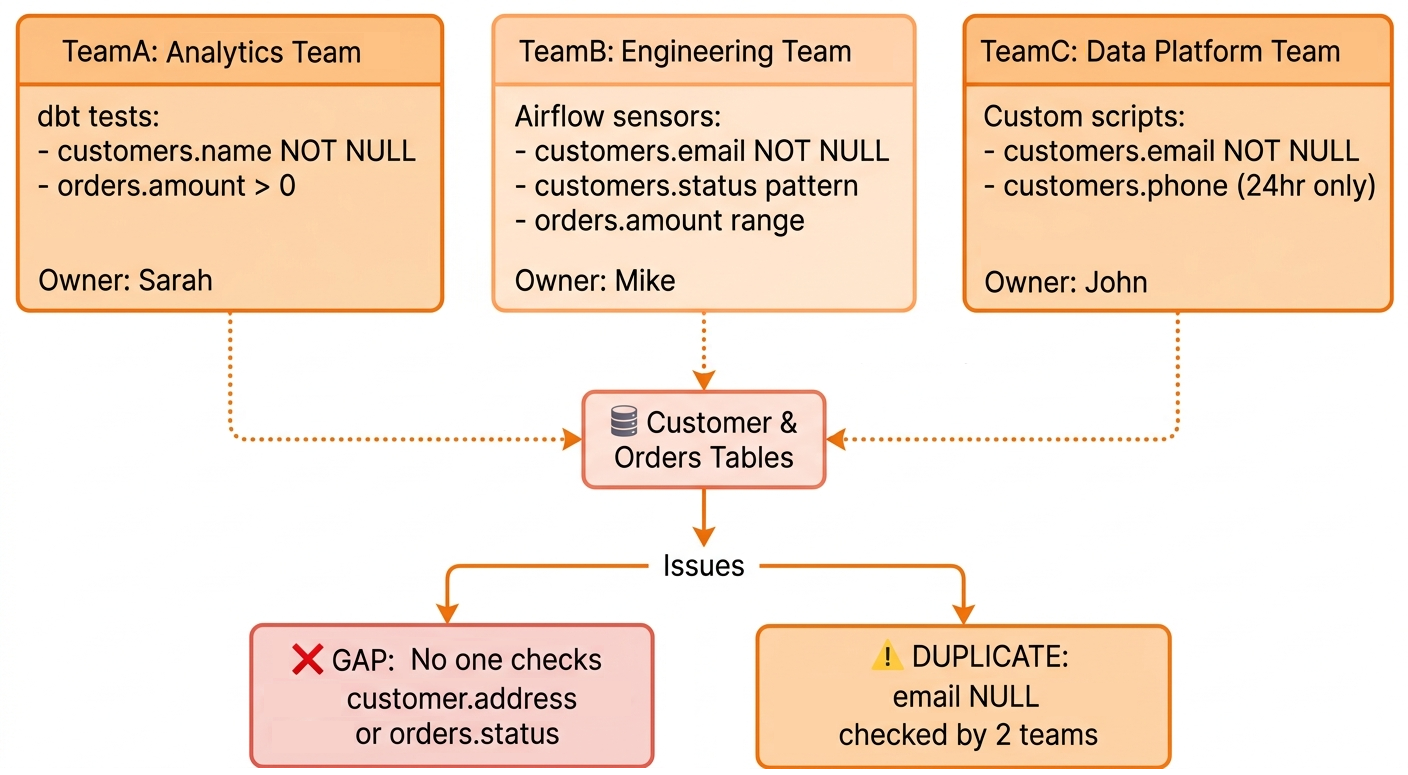
This scattered approach fails as the following three problems emerge:
- Duplication: Teams independently solve identical problems.
- Gaps: Critical data goes unchecked because everyone assumes someone else handles it.
- Maintenance debt: When engineers leave, their checks become orphaned code that nobody understands.
You know it's time to move forward when the effort to coordinate among teams becomes greater than the effort to centralize. If teams spend more time fixing conflicting checks than creating new ones, or if adding new data sources takes weeks because everyone builds their own checks, it's time to centralize.
To advance, start using a centralized platform. List all your current checks, and set standards for the whole organization. Bring all your checks together in one place so they are easy to see, reuse, and maintain.
Level 2: Centralized data quality
Centralizing brings all your checks into one platform, so every rule is in the same place and teams follow the same standards. This makes it possible to measure quality scores and see trends over time. This is how most incumbent data quality platforms work, and it's a significant step forward from fully manual, decentralized approaches.
The main challenge now is that all rules must be written by hand by a specialized technical team. Business users can't write their own checks because they don't have access to the needed tools or data models. For example, adding a warehouse with 50 tables can take weeks, leaving data unmonitored during that time. This creates a dependency on a limited set of experts, and as data complexity grows, the backlog grows faster than the team can address it.
Manual checks only cover the issues your team can anticipate and has the bandwidth to monitor; there will always be many unknown risks they never even think to write checks for. At this level, data quality checks tend to be limited to key tables, executive dashboards, and regulated data. Other areas get minimal attention or are left unchecked.
A centralized platform offers a rule library, unified visibility, and a foundation for governance. However, at this level, technical specialists still write every rule by hand regardless of what the platform can do.
As data scales, manual rule authoring alone can't keep up. Many teams at Level 2 pursue operational monitoring in parallel, implementing freshness checks, volume tracking, and schema change detection. Integrating these into your CI/CD workflows leads you to Level 3.
Level 3: Data observability
Data observability is the practice of tracking the operational health of your data pipelines, answering whether data arrived on time, in the expected volume, and with the expected structure. At this level, operational failures are caught fast; for example, a 3 am ETL crash is detected before standup, and missing deliveries are escalated before reports break.
The main limitation is that observability answers “Did the system work?” but not “Is the data correct?” For example, an orders table might load on time with the right number of rows, but 20% of orders could have negative prices. Observability would say everything is fine, but the business would still have bad data.
Another problem that your team will face here is alert fatigue. Volume spikes during seasonal changes can cause false alarms, and freshness alerts might go off during planned maintenance. The root cause is often static thresholds that lack business context. Teams end up investigating normal business operations that are mistakenly flagged as anomalies. Over time, this alert fatigue leads teams to deprioritize notifications, increasing the risk of missing genuinely critical issues.
Making things worse, some organizations run observability and quality as separate systems with separate teams. This creates blind spots where neither catches semantic errors, whether that is incorrect calculations, violated business rules, or failed regulatory requirements.
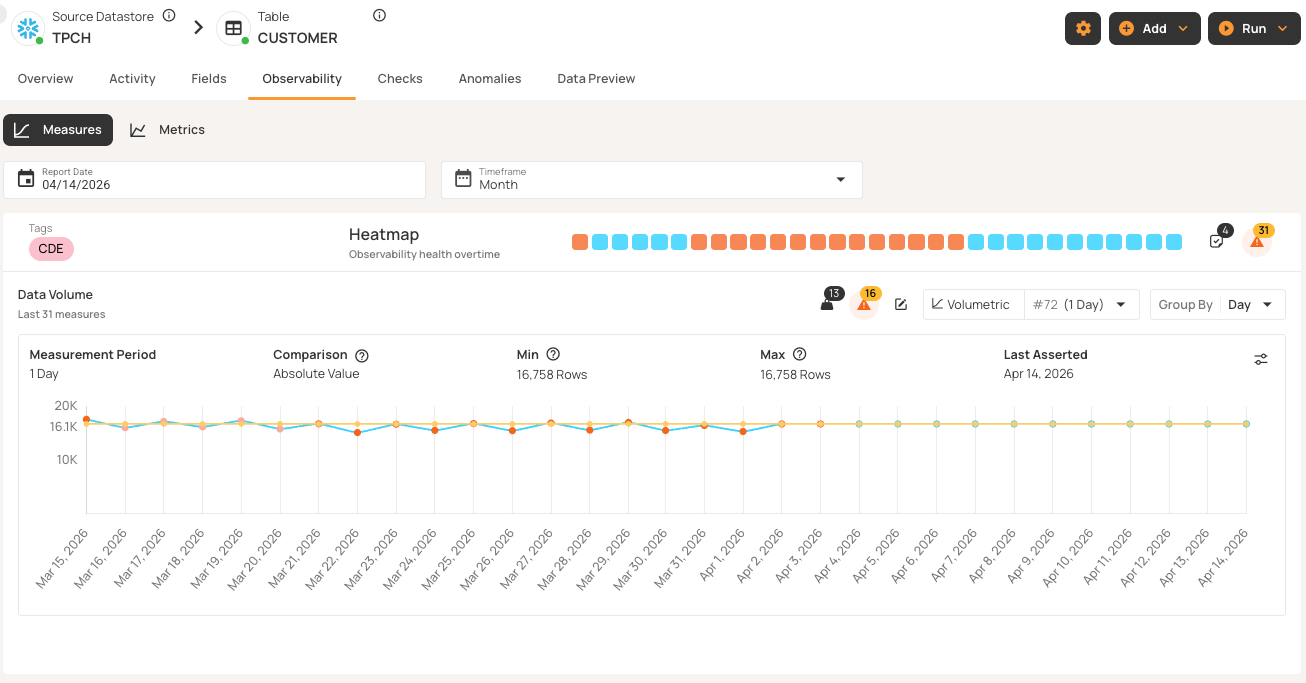
Qualytics handles freshness monitoring, volume tracking with learned baselines, and schema detection. And unlike standalone observability tools, it also checks whether the data itself is actually correct. The screenshot below shows how Qualytics tracks data volume over time, with automatically learned thresholds that flag deviations from expected patterns. Blue markers indicate days where volume stayed within the expected range, while orange markers highlight days where volume exceeded the learned threshold bounds without reaching critical anomaly status.
To reach Level 4, it's important to recognize that operational monitoring alone isn't enough. The challenge is to achieve broad quality coverage without writing thousands of checks manually.
Level 4: AI-only data quality
AI-driven platforms automatically profile datasets and detect statistical deviations. They use black-box anomaly detection to analyze distributions, learn patterns, and flag anomalies without manual rule writing. This means every field is monitored automatically, not just the ones someone had time to check.
Automated profiling solves the coverage gap described at Level 2: Teams no longer need to write every check by hand, and every table and column is covered by default. Now, for example, the system might detect that order values shifted 40% above the historical average, or that a field's distribution changed shape overnight, even if no one thought to add checks for those things. New data sources are profiled quickly, revealing hundreds of potential issues that manual checks might miss.
The challenge at Level 4 is using automation without proper governance. Organizations use automated profiling and anomaly detection, but they haven't set up processes for domain experts to validate and refine the inferred rules. For example, the platform might alert you to unusual account balances, but teams have to investigate each alert from scratch to decide whether it's a real issue or just normal end-of-quarter behavior. And because that judgment is never captured back into the platform, the same pattern resurfaces and gets re-investigated next quarter.
Without defined workflows for who owns and validates rules, your teams end up triaging alerts instead of preventing issues. And if you are in a regulated industry, compliance teams will want explicit policies traced to business requirements, not just automated detection. Because detection is opaque and business logic is undocumented, resolving issues takes longer and explaining findings to auditors becomes difficult.
Platforms like Qualytics let you adjust inference tiers to control how aggressively the system creates automated checks.
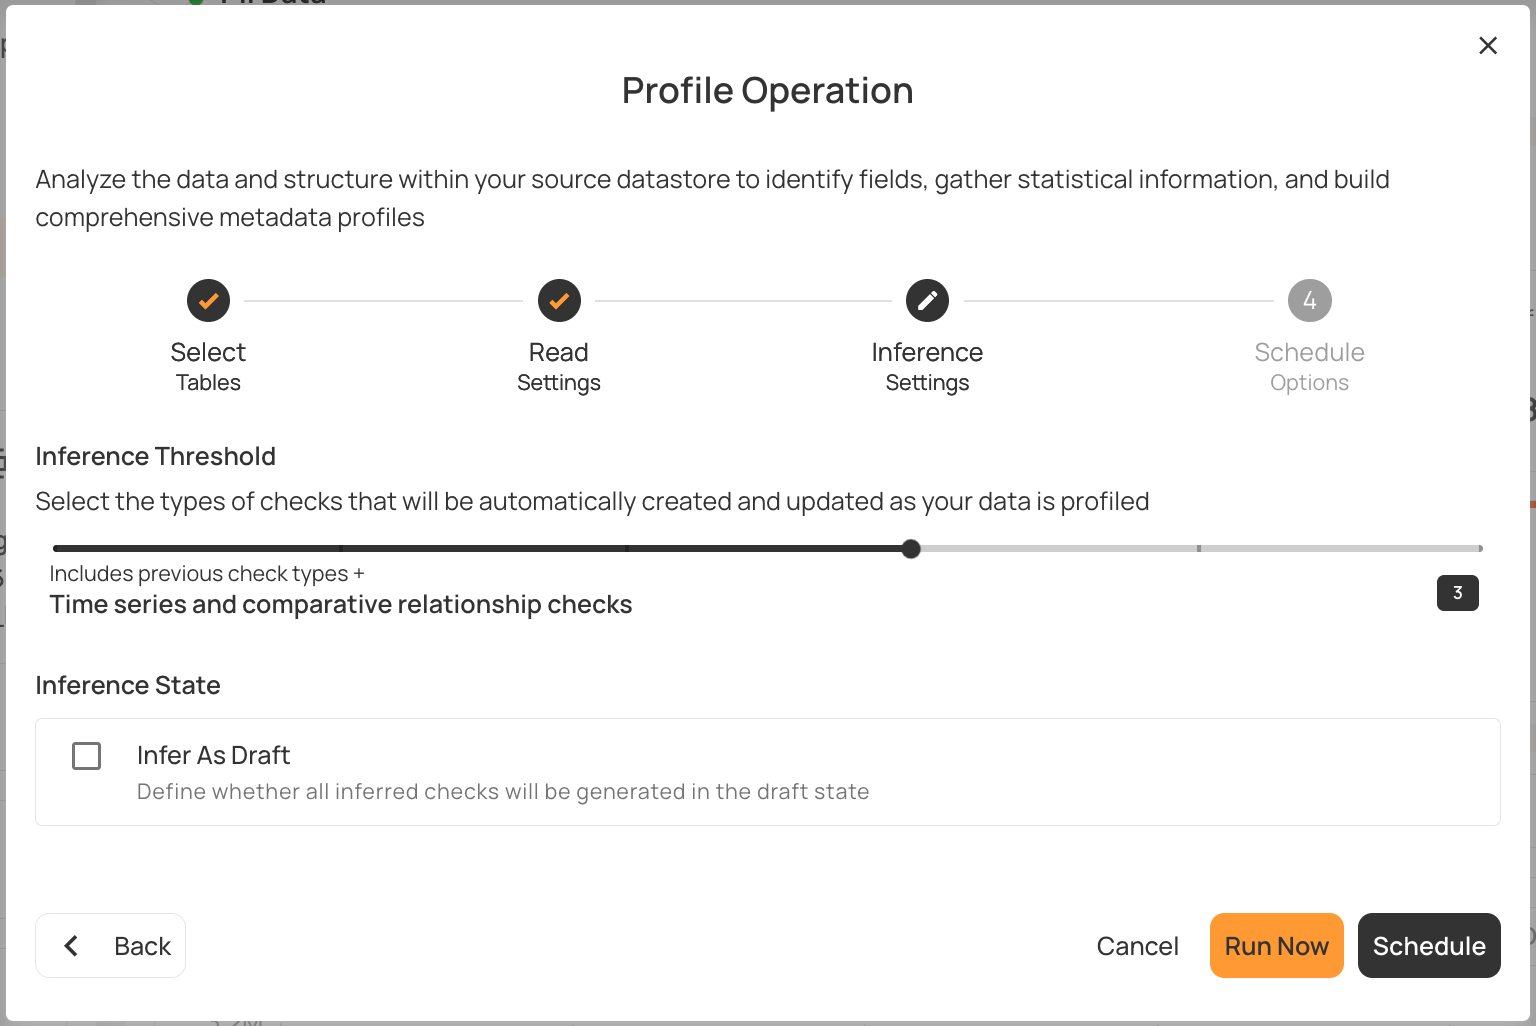
Teams can choose their preferred tier of inference sensitivity, ranging from no automation (Tier 0) to advanced analysis (Tier 5). Each tier adds more sophisticated check types, expanding coverage and increasing rule complexity. The table below shows what each tier detects.
This sophisticated inference helps reduce false positives; however, organizations at Level 4 haven't yet included domain expertise in the detection process. As a result, alert triage becomes manual work: reviewing anomalies, deciding if they're relevant, and marking patterns as valid or invalid as needed. Business teams may provide requirements, but they rely on the data team for execution and are not directly involved in the quality process.
So, while profiling, configurable inference levels, and quality scoring get you to Level 4, the full value is achieved at Level 5, where human judgment is added so that automation meets governance.
Level 5: AI-augmented data quality
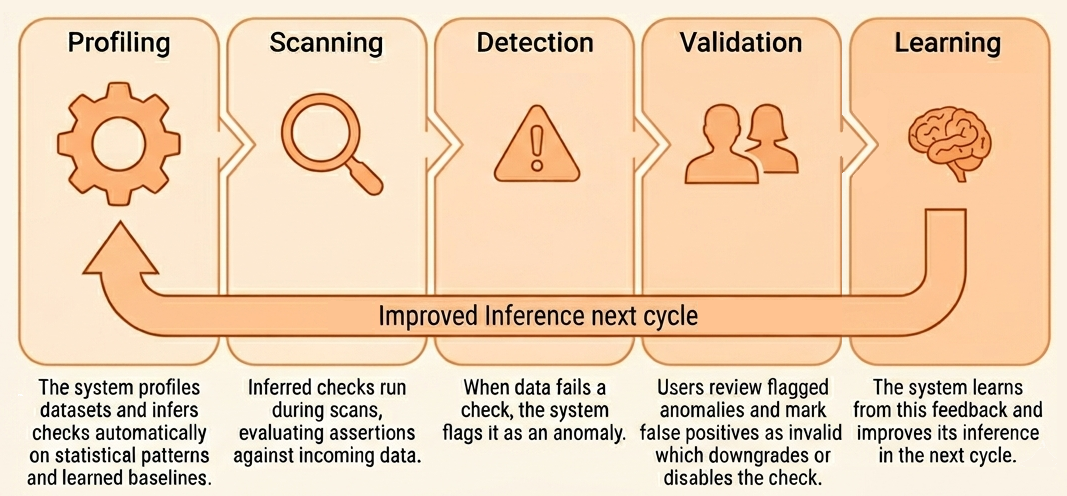
This is where automation and human judgment come together; the augmentation of AI involves integrating technology with human oversight. The platform profiles your data and generates rules automatically, but your domain experts are the ones who review those suggestions, confirm what they actually mean for the business, and take ownership of the outcomes. This includes advanced checks such as:
- Entity resolution: Detecting duplicate records across name variations
- Reconciliation: Comparing totals across systems
- Aggregation comparisons: Validating summary metrics against source data
- Cross-datastore checks: Asserting consistency between databases
This review process creates a feedback loop. You can archive or disable inferred checks before they ever run if they don't reflect real business concerns. When anomalies are detected, marking them as invalid tells the system that the flagged item is actually within acceptable bounds . Over time, the system gets better because it is learning from your decisions, not just from statistical patterns. This is the difference from Level 4: instead of investigating the same anomaly every time it recurs, a domain expert validates it once. Marking an end-of-quarter spike as expected teaches the system to stop flagging it and records who made that call and why — so human judgment is captured as a reusable, owned rule rather than spent on repeat triage.
The key change is accountability. Rules are not just inferred—they are owned. Business teams define what “good” means for their area, while technical teams ensure rules are kept up to date as systems change. Detection, ownership, and enforcement all scale together as one system.
Rules are versioned and easy to explain. When an anomaly is detected, there is a documented policy explaining why it matters. Audit trails show who validated the rule, when it was last reviewed, and what business requirement it supports. This lets the system meet compliance and regulatory needs in ways pure automation cannot.
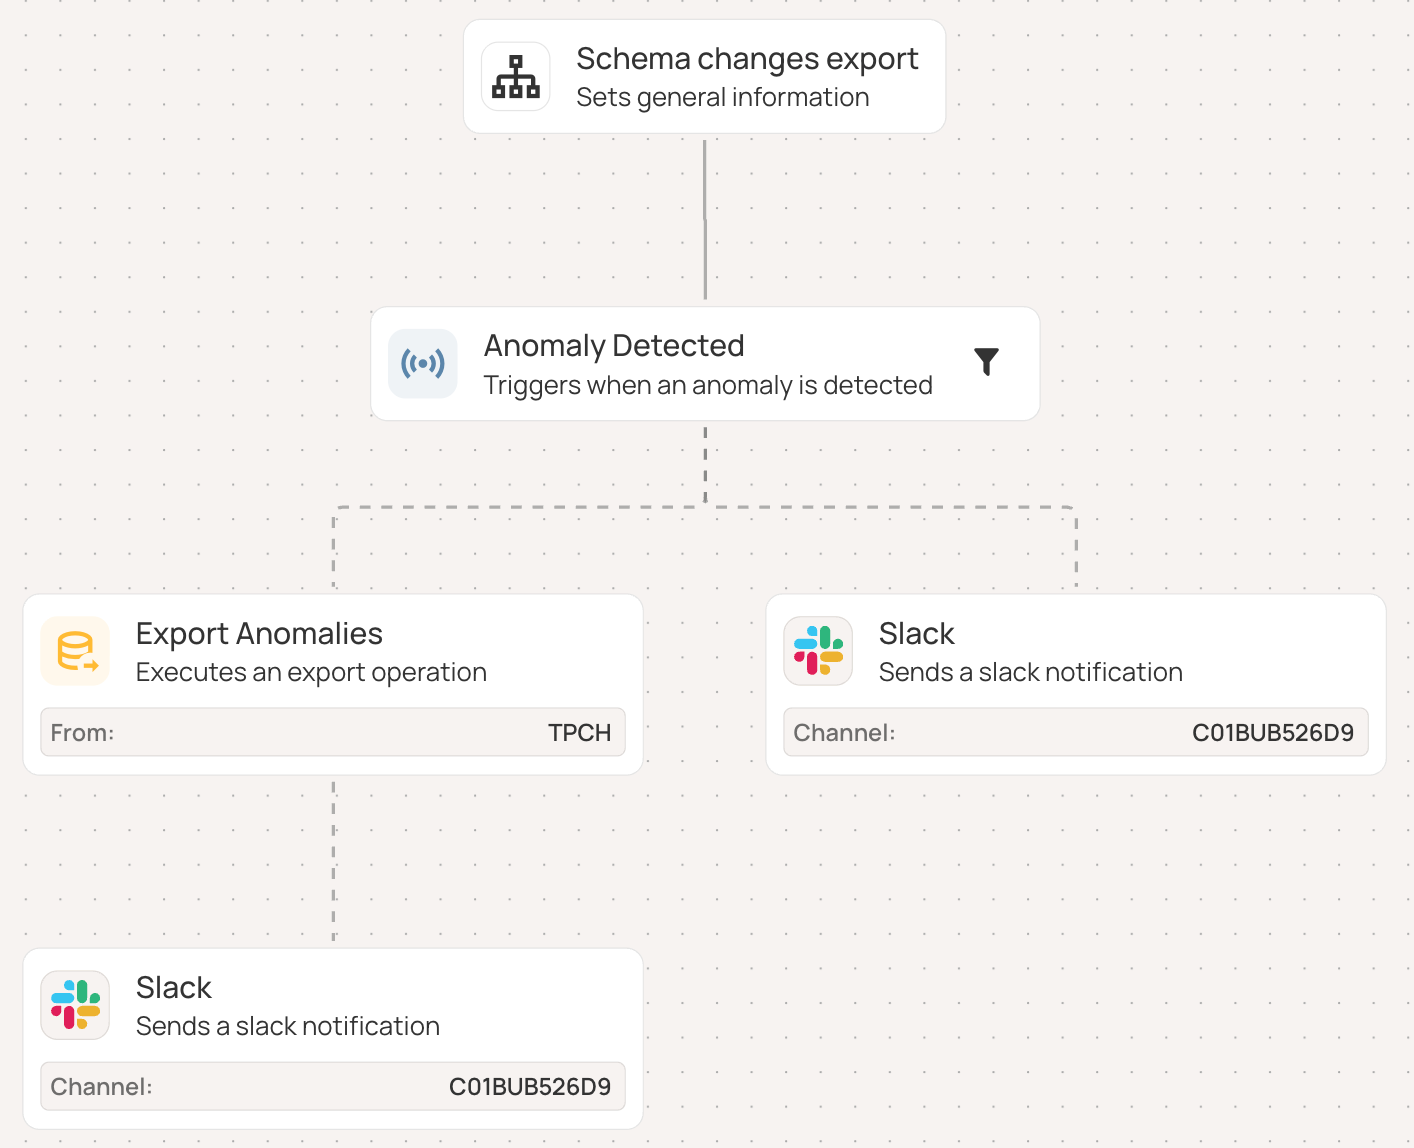
Remediation follows set workflows. When an anomaly is detected, it is acknowledged, assigned to the right owner, resolved, and tracked until completion. Qualytics Flows automate this process through a series of connected steps, triggered by events like a completed scan, and can send notifications or run extra checks. Integration with Jira, Slack, Teams, and PagerDuty sends anomalies to the right people automatically.
The benefits add up: automated coverage without alert fatigue, clear standards that meet compliance needs, ongoing improvement through feedback, and clear ownership that brings business and technical teams together.
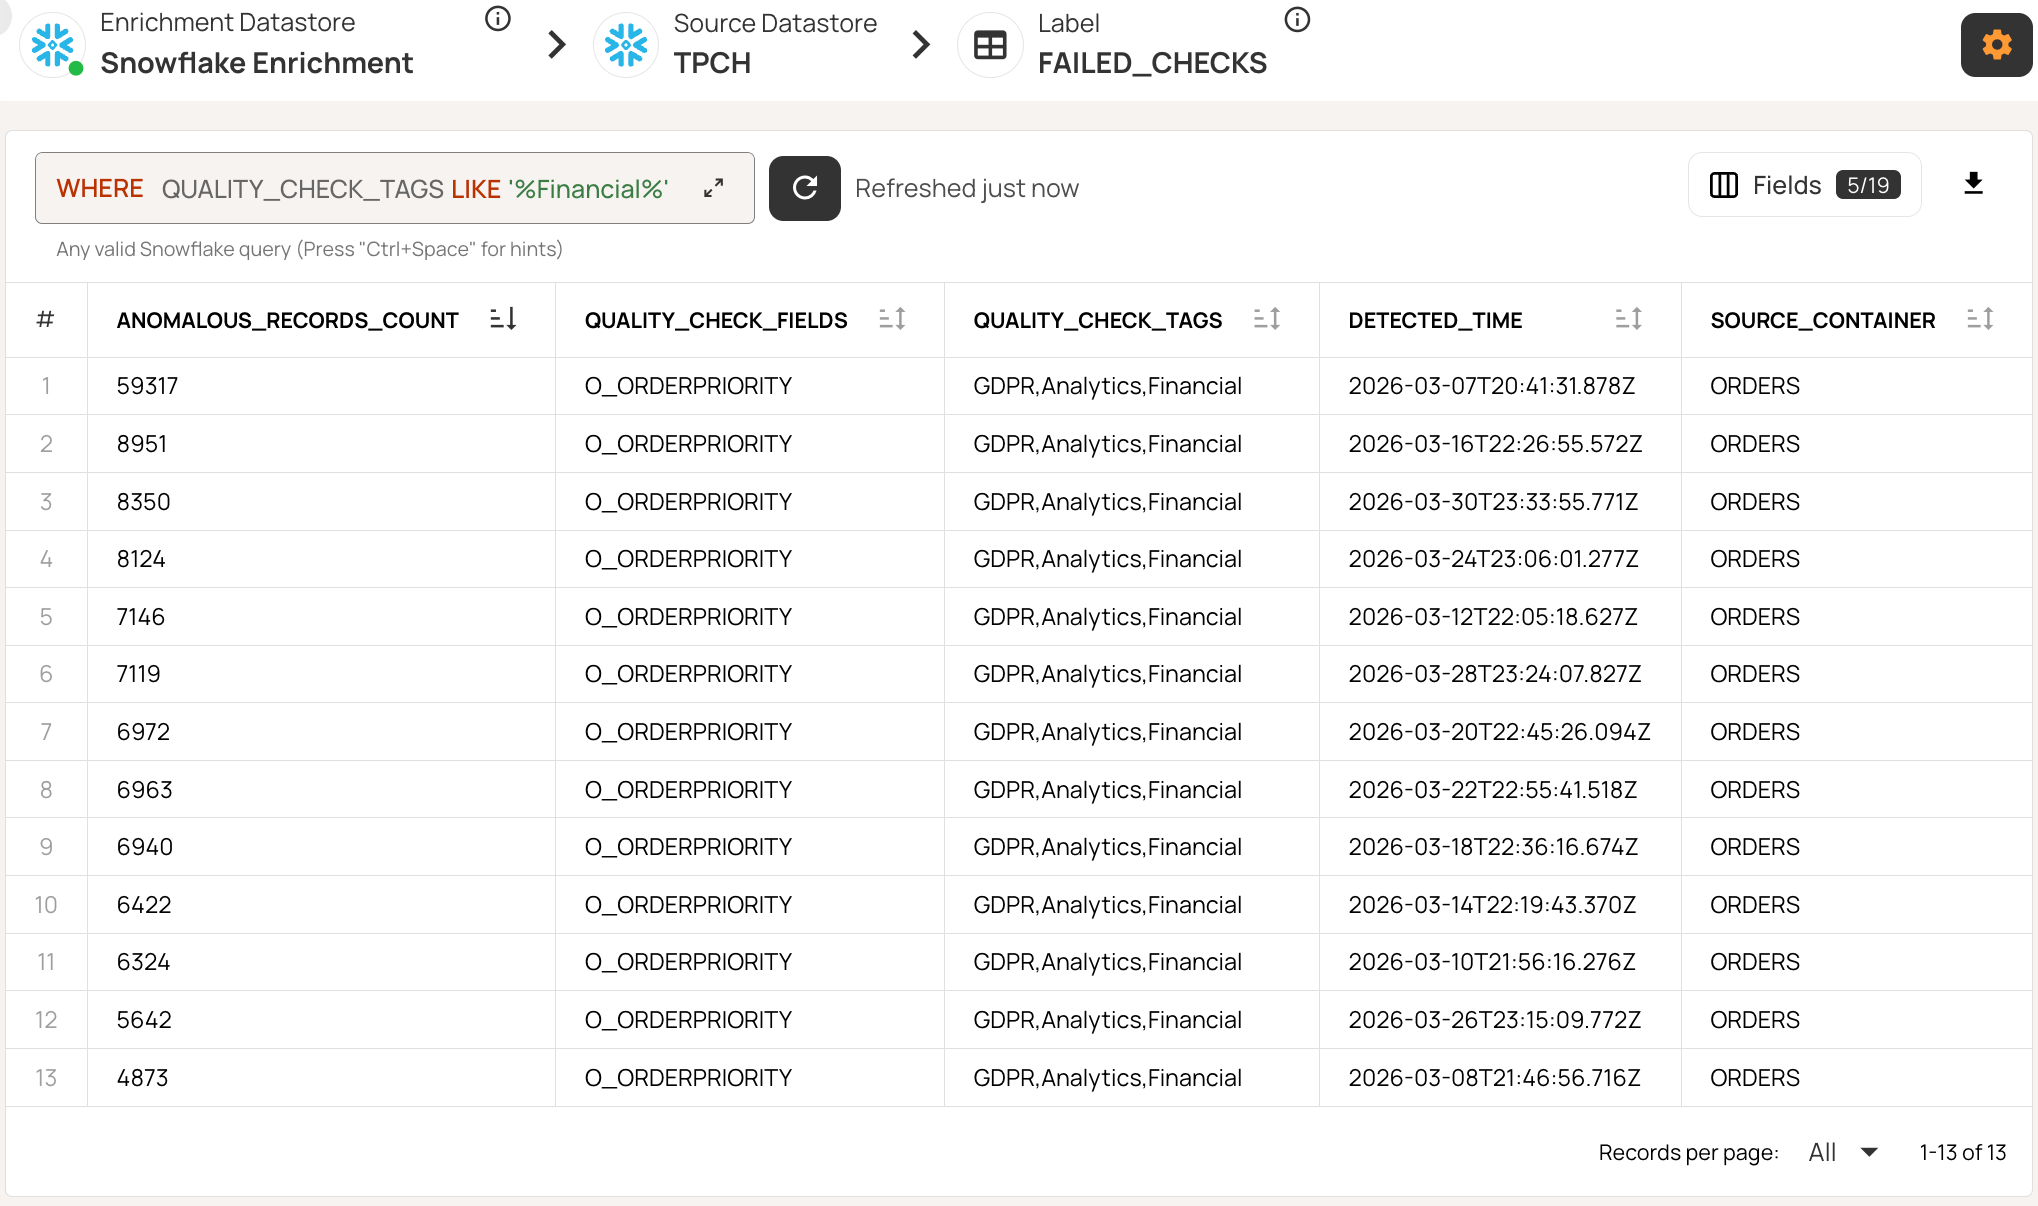
With Qualytics, 95% or more of your checks are inferred and maintained automatically, while your domain experts still get to validate and refine the rules. The enrichment datastore pushes all of this metadata back to your own repository, so you can query it with SQL, plug it into your BI tools, or explore it directly in the UI.
For example, you can filter anomalies by tag, source table, time period, etc., directly with SQL. The following query retrieves high-volume financial anomalies from the ORDERS table in March.
SELECT
    ANOMALOUS_RECORDS_COUNT,
    QUALITY_CHECK_FIELDS,
    QUALITY_CHECK_TAGS,
    DETECTED_TIME,
    SOURCE_CONTAINER,
FROM _TPCH_FAILED_CHECKS
WHERE QUALITY_CHECK_TAGS LIKE '%Financial%'
  AND DETECTED_TIME >= '2026-03-01'
  AND DETECTED_TIME < '2026-03-08'
  AND SOURCE_CONTAINER = 'ORDERS'
  AND ANOMALOUS_RECORDS_COUNT > 1000
ORDER BY ANOMALOUS_RECORDS_COUNT DESC
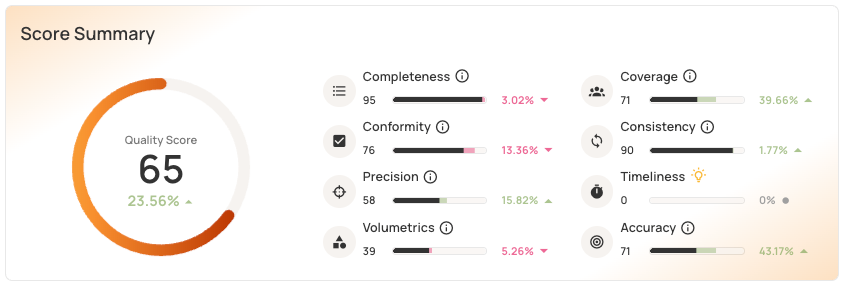
The Qualytics unified scorecard gives visibility into quality across eight dimensions: completeness, coverage, conformity, consistency, precision, timeliness, volumetrics, and accuracy. End-to-end anomaly lifecycle management tracks issues from detection to resolution, with full collaboration features.
Level 5 is not something you set up once and walk away from. As your business logic changes, your rules need to change with it:
- When you onboard new data sources, apply the patterns you have already established.
- Make sure new team members learn your standards, and wire quality gates into your CI/CD pipelines.
- Track what you are saving in time and what you are catching before it becomes a problem.
Qualytics handles much of this automatically: new data sources are profiled and checked on connection, inferred rules update as your data evolves, and Flows route issues to the right owners without manual triage. The ongoing effort shifts from writing and maintaining checks to reviewing what the platform surfaces.
What separates this level from the rest is not the automation itself. It is having governance, accountability, and a system that keeps learning. The technology gets you there, but your organizational readiness is what makes it stick.
Assessing data quality maturity
To assess where your organization stands, consider the following categories. For each, we describe the progression from early to advanced maturity:
- Profiling and discovery: From no profiling to basic automation to deep deterministic profiling across fields and relationships.
- Rule management: From scattered scripts to centralized manual authoring to automated inference of explainable rules.
- Coverage and scale: From minimal to known assets limited by capacity to broad automated monitoring.
- Anomaly detection: From finding out when someone complains to observability catching some problems to automated detection before issues reach the business.
- Remediation: From ad hoc fixes to informal processes to governed workflows with ownership and resolution history.
- Business and data team collaboration: From business teams only reporting issues to inconsistent involvement to co-owning quality from definition through resolution.
- Governance and auditability: From no way to demonstrate quality to showing rules and metrics to full audit history exportable on demand.
{{banner-small-1="/banners"}}
Last thoughts
In this article we covered six levels of data quality maturity, from reactive firefighting to proactive AI-augmented governance. For each level, we discussed the main challenges, how to recognize them, and steps to move forward.
Start where your deficiency is greatest. Quick wins come from centralizing existing checks. The biggest impact comes from AI-augmented platforms like Qualytics that break through manual bottlenecks. Many enterprises at Levels 1-3 underestimate how modern platforms accelerate progress from weeks of manual work to hours of automated profiling.
Chapters
Improving Data Governance and Quality: Better Analytics and Decision-Making
Learn about the relationship between data governance and quality, including key concepts, implementation examples, and best practices for improving data integrity and decision-making.
Data Quality Checks: Tutorial & Automation Best Practices
Learn the fundamentals of data quality checks, like structural and logical validation, monitoring data volume, and anomaly detection, using practical examples.
Data Quality Assessment: Tutorial & Implementation Best Practices
Learn systematic approaches to assess data quality using automated tools and best practices for reliable validation.
Data Quality Dimensions: A Complete Guide with Examples
Learn the eight data quality dimensions every data engineer needs to ensure reliable, accurate data pipelines.
Data Quality Scorecard: Dimensions, Granularity, and Best Practices
Learn how a data quality scorecard helps you measure, track, and improve your organization's data quality.
What to Look for in Data Quality Software: A Guide to Features
Learn which data quality software features help teams build and sustain scalable, automated quality programs.
From Reactive to Reliable: A Guide to Modern Data Quality Frameworks
Learn the six core components of a data quality framework and how they work together to ensure reliable data.
Data Quality Automation: How Modern Platforms Validate at Scale
Learn how automated data quality platforms infer validation rules, detect anomalies, and support remediation at scale.
Data Validation Software: 10 Must-Have Features to Look For
Learn how to evaluate data validation software using 10 must-have features for scalable, automated data quality.
The Data Quality Maturity Model: A Six-level Model for AI Readiness
Learn the six-level data quality maturity model that maps your organization's path from ad hoc fixes to proactive AI-augmented governance.
Data Quality Metrics Examples: The Complete Guide
Learn how to turn abstract data quality dimensions into computable, actionable metrics that catch pipeline failures and data errors before they become incidents.
How to Choose the Best Data Quality Tools for Your Team: Key Features and Benefits
Learn what modern data quality tools do, why they matter, and how they use AI and automation to keep your data trustworthy.