Learn how a data quality scorecard helps you measure, track, and improve your organization's data quality.
Table of Contents
Like this article?
Follow our monthly digest to get more educational content like this.

A data quality scorecard provides a quick-reference view of your organization’s data quality. Unlike a one-time audit, which provides a snapshot of your data quality, your data quality scorecard should provide a structured, ongoing view of quality metrics. A scorecard helps you build trust in your data, provides accountability for improvements, and documents progress over time. It serves as a single source of truth that enables cross-functional collaboration among executives, data owners, and engineers.
In this article, we walk through what separates a useful scorecard from a superficial one: what to measure, how to display it, how to customize it for your organization, and what it takes to ensure that the scores it shows actually mean what you need them to mean.
Summary of key data quality scorecard concepts
{{banner-large-1="/banners"}}
Data quality scorecard dimensions
Your data quality scorecard should provide a high-level aggregate quality score suitable for executives but must also break down further to enable data engineers to track where quality may be breaking down. Scorecard metrics should map directly to the eight data quality dimensions: accuracy, completeness, consistency, volumetrics, timeliness, conformity, precision, and coverage. Typically, scores are assigned at the field level and aggregated up as a composite, reflecting the relative configured weights of each field (which may be inherited from a table or data source).
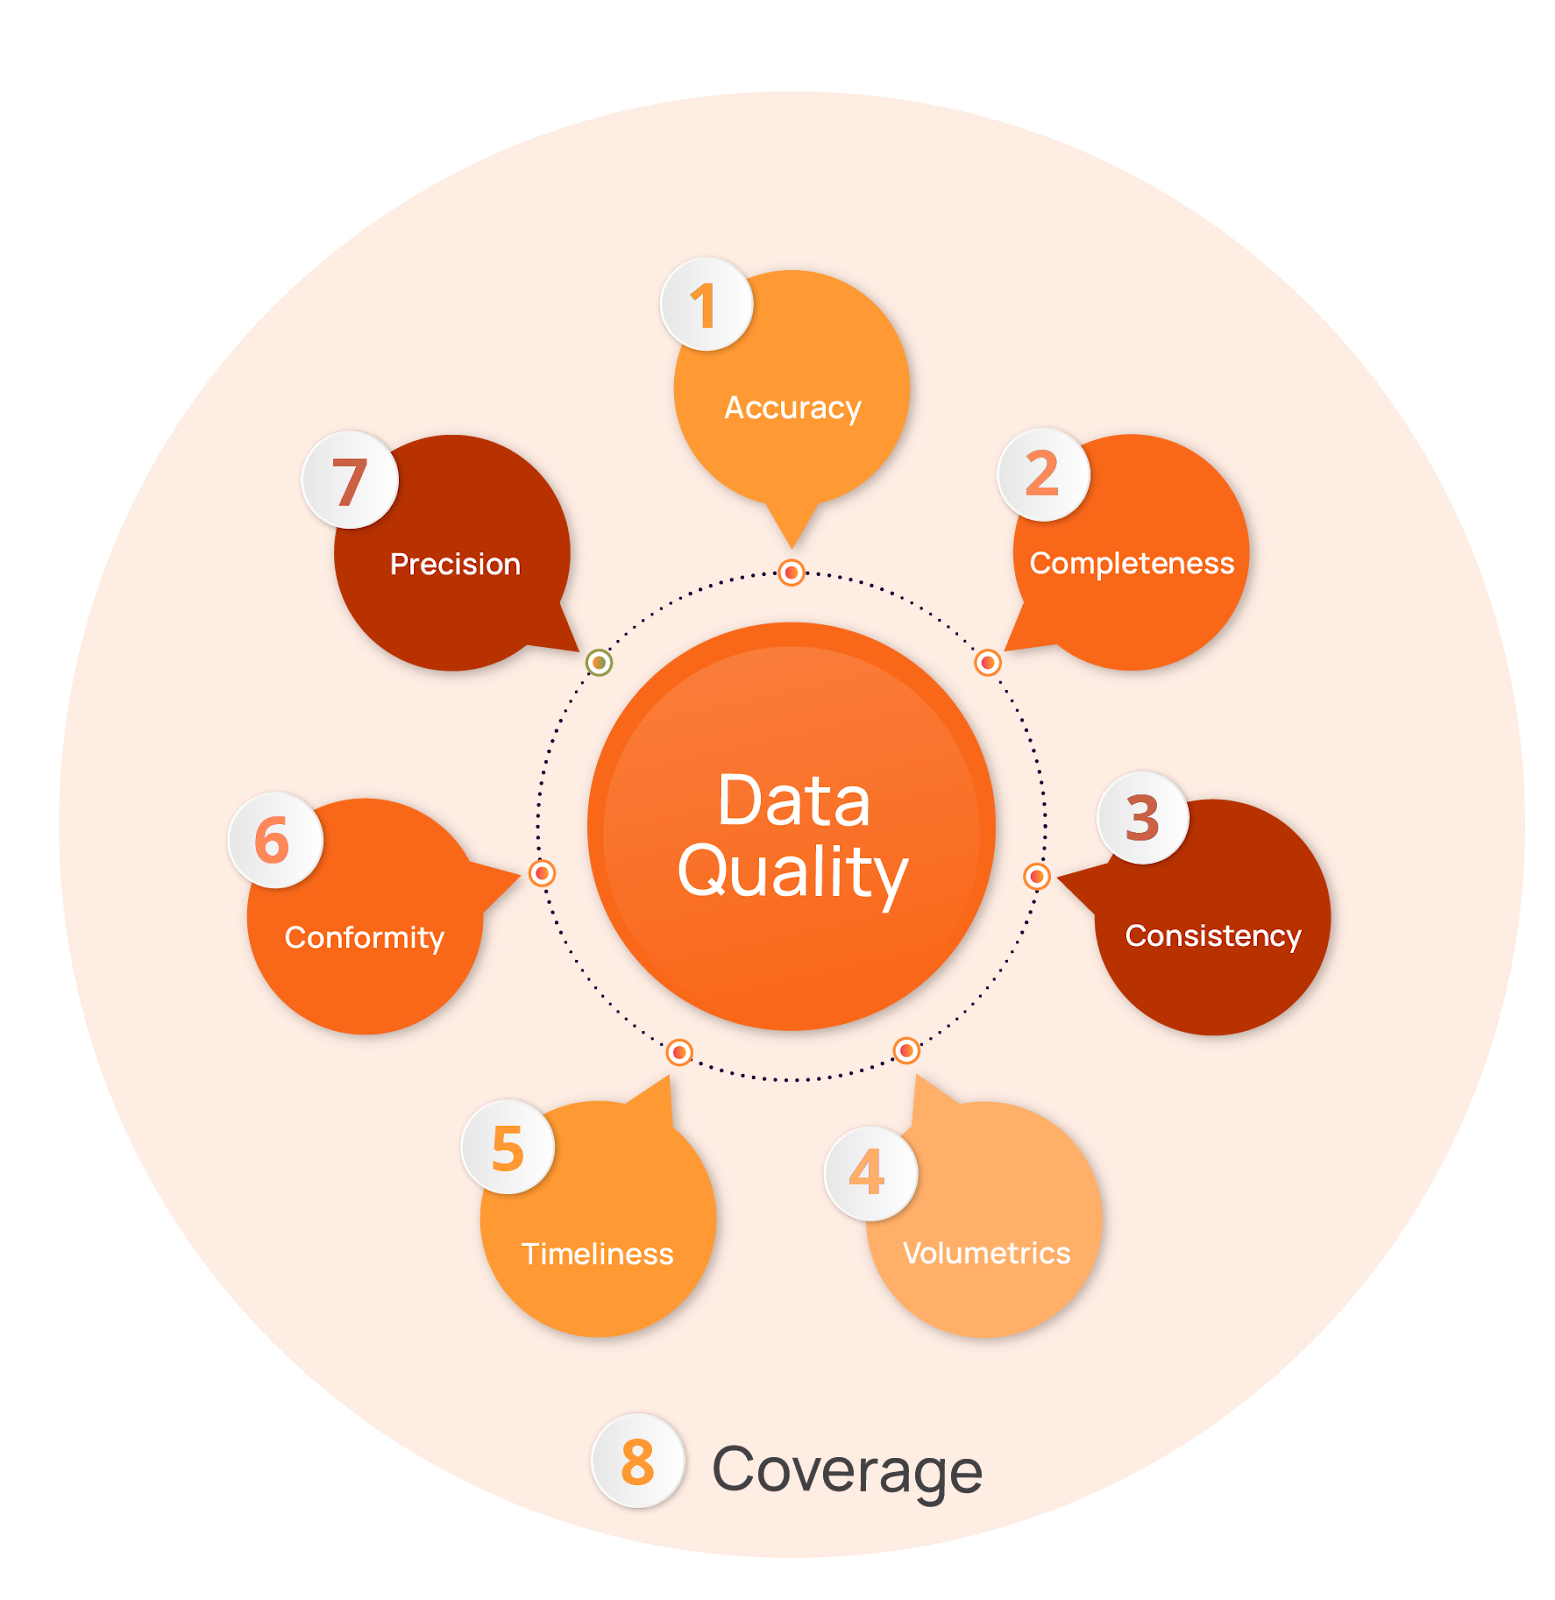
Here is a summary of the high-level definitions of the eight data quality dimensions.
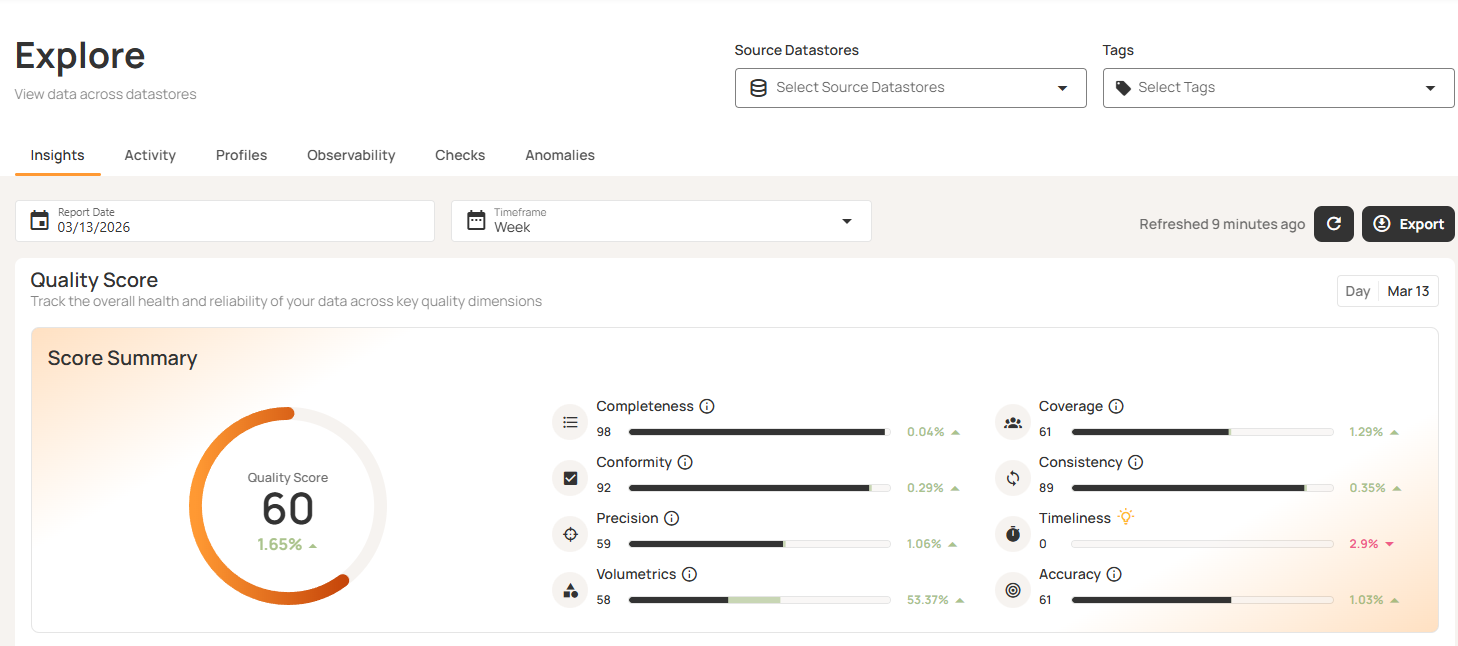
Coverage is particularly important here, as it assesses the degree to which data is monitored. A high quality score on 10% of your fields is misleading; thus, coverage must itself be a scorecard metric. The simplest version of a coverage metric can be computed by dividing the number of fields with active checks by the total number of fields (often multiplied by 100% to express it as a percentage). More complex versions of the metric give a coverage score to each field, rewarding the first check on a field the most but giving a decreasing additional reward for each additional check. Qualytics uses the following exponential growth formula, with k tuned so that one check (n=1) gives a score of 60:
score(n) = 100 × (1 - e^(-k × n))
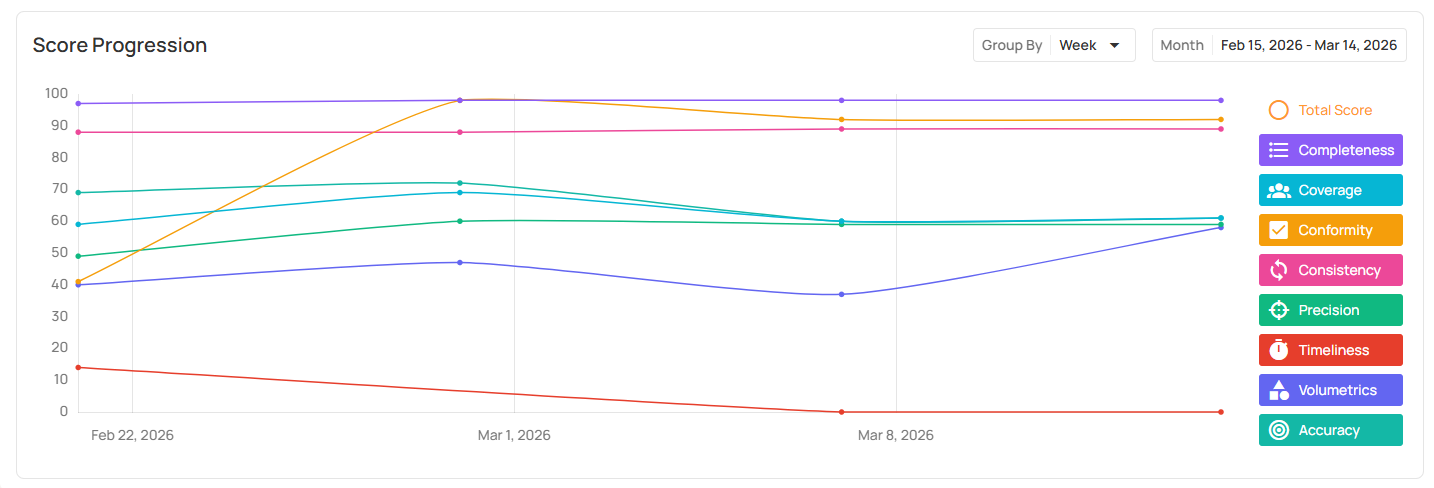
In this sample Qualytics Explore dashboard, you can see that there are potential issues across the board, but timeliness appears to be the most critical.
Scorecard granularity
Your scorecard should ideally support three levels of granularity: enterprise-wide, data-source/container level, and table/field level.
Enterprise-wide
Your enterprise-wide data provides a quick overview of your organization’s data quality and primarily serves executives who want the big picture. They need a high-level understanding of “how healthy is our data estate?” without having to interpret technical detail. This tier can also be helpful for compliance reporting and audit evidence, providing a documented quality score over time across the enterprise.
Most scorecards will default to the enterprise-wide view. Ideally, they will also let you drill down as needed.
Data-source/container level
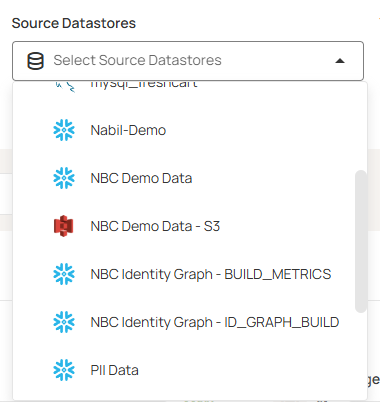
Data owners and stewards need visibility into the sources and domains they are responsible for. Source-level scores can also support accountability by providing visibility into whose data quality is not up to enterprise standards.
Qualytics allows you to select one or more datasets to filter the scorecard down, as shown below.
Table/field level
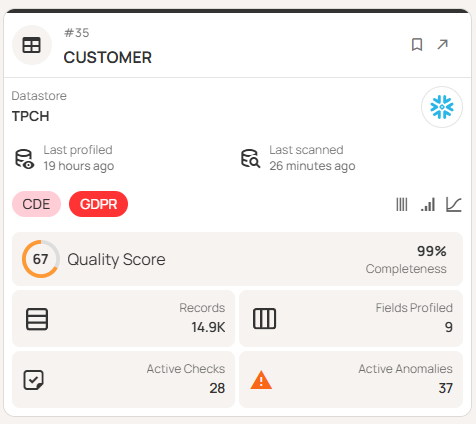
Finally, while engineers are usually alerted to anomalies via a separate anomaly workflow, they can use the table- and field-level information in the scorecard to confirm that the monitoring program is healthy and complete. In particular, the scorecard can help them identify fields without sufficient active checks, a situation that can otherwise lead to blind spots and overconfidence in the data. They can also use the scorecard to monitor for issues like checks that are in invalid or draft states, rules that have never fired, or fields with unusually high anomaly rates, which can indicate configuration problems.
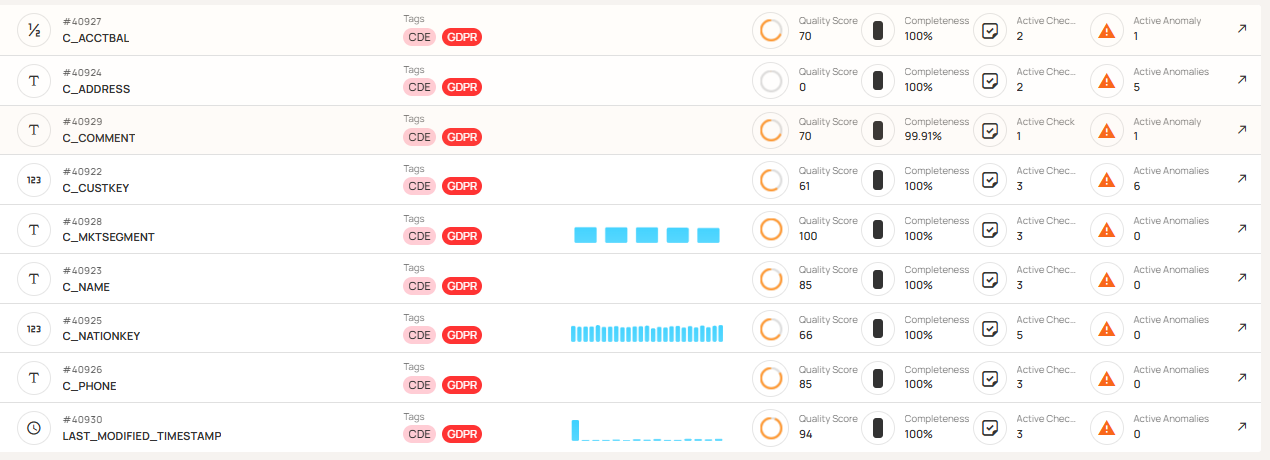
Qualytics offers views at every level. Below you can see an example of a summary scorecard for a table and a view summarizing scores for all the fields in that table. Other views giving more detail at both the table and field level are also available.
Custom views for business-specific needs
Even beyond the levels of granularity described above, different organizations need different scorecards: by business unit, regulatory domain, or service level agreement (SLA) tier, for instance. If your business requires custom views not offered out of the box by the commercial vendors, you may think that you need to build your own scorecard. Fortunately, some vendors offer ways to generate custom views to suit your specific business needs.
The simplest version of this is tag-based filtering. You will likely want a scorecard that allows different stakeholders to slice the scorecard by features like domain, environment, regulatory category, or criticality to get the view they need when they need it.
You sometimes really need a bespoke view, though, whether to focus on a few fields of interest to the marketing team, comply with regulatory requirements, or monitor the handful of fields a critical downstream pipeline depends on. In this case, you will want a scorecard in which the underlying data is queryable and accessible to the business intelligence tools you use. Qualytics writes all of its quality findings to an enrichment datastore that is queryable via SQL, Power BI, Tableau, etc. to allow you to build any additional views you may need.
Whatever your needs, the goal is the same: Every stakeholder should have access to the view that answers their specific questions about data quality without having to dig through a lot of data that is less relevant to them. The right scorecard doesn’t force your organization to adapt to its structure, instead giving you the tools to support yours.
Additional important scorecard features
Covering all the important dimensions of data quality and displaying it at multiple levels of granularity are the foundations of a strong scorecard, and custom views allow your scorecard data to support a broad range of business needs. The additional features below round out what you should expect from a mature data quality scorecard solution.
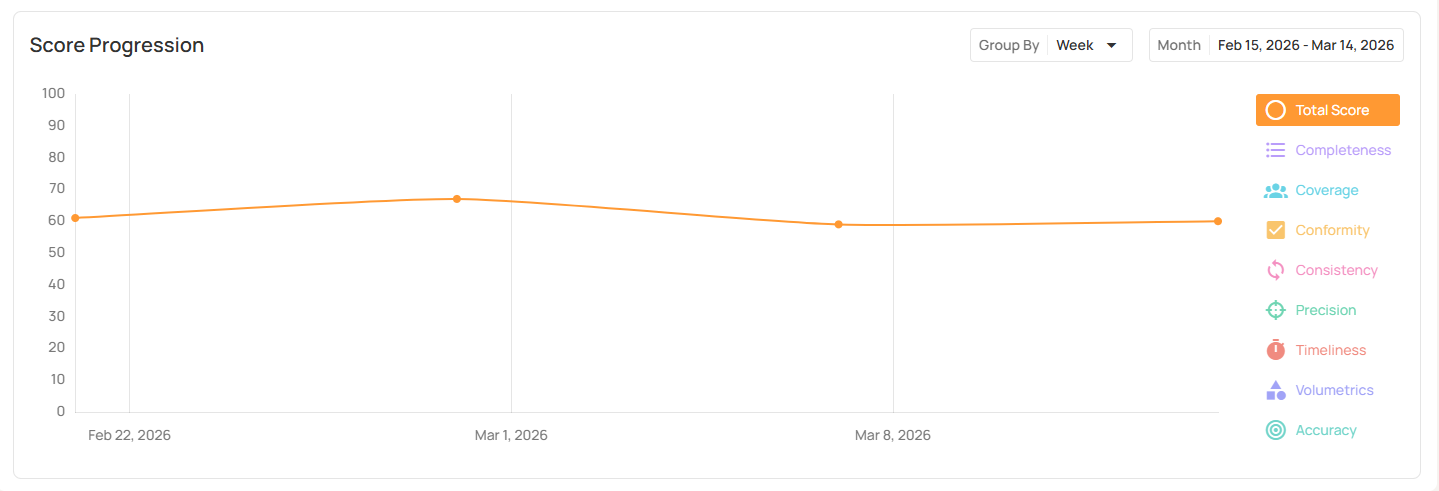
Score progression over time
Your scorecard should not be merely a snapshot of your data quality at this moment in time; it should provide trend lines so that you can track your progress and notice any regressions more quickly. A score of 82 means little on its own, whereas a score that has moved from 60 to 82 over 90 days tells a story about progress.
Anomaly summary
A quick view of anomaly counts by status (active, acknowledged, resolved, duplicate, invalid, discarded) allows you to keep an eye on progress toward resolution.
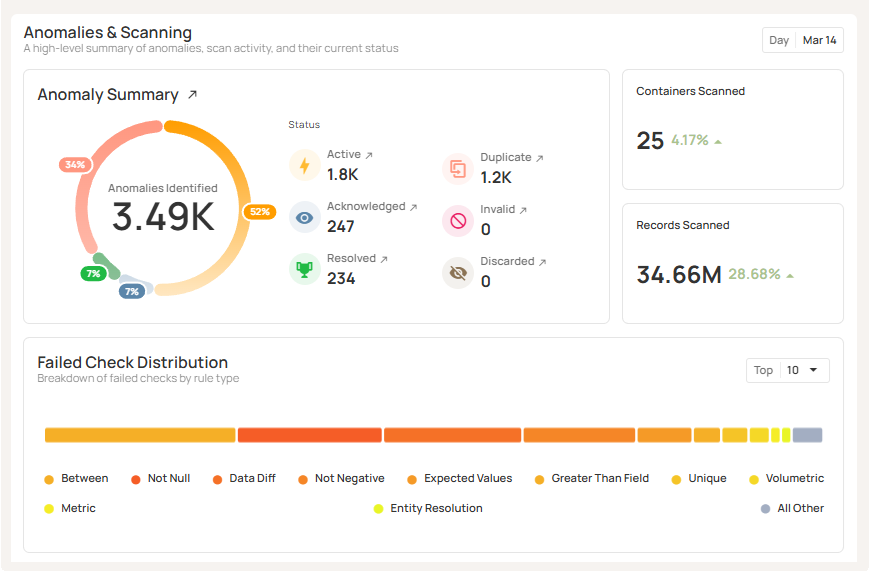
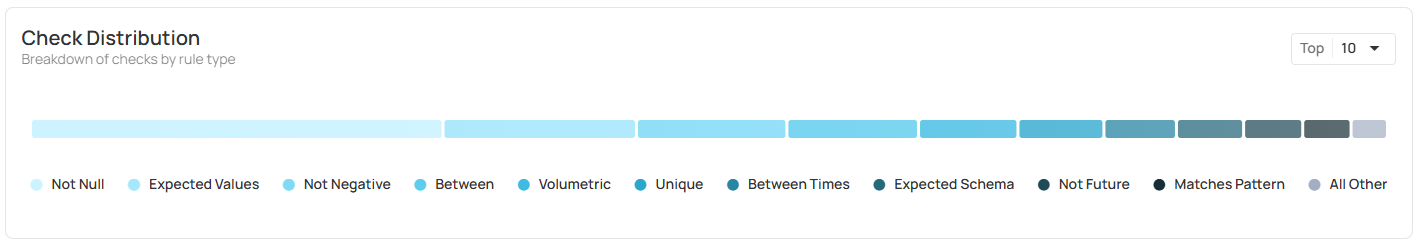
Rule type distribution
A quick view of the distribution of rule types can help you discover coverage patterns and potential gaps in your data quality checks.
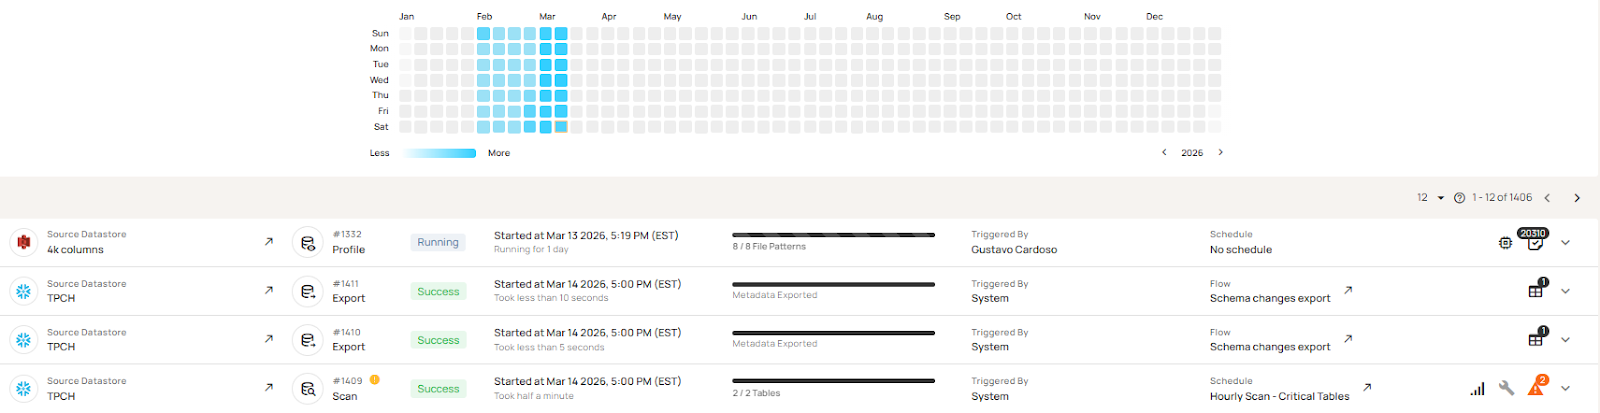
Profiling activity and scan cadence
If you are not routinely updating your data profile and running regular scans at an appropriate cadence, you are not getting the most from your data quality management tools and may not have a current enough view of data quality to act on.
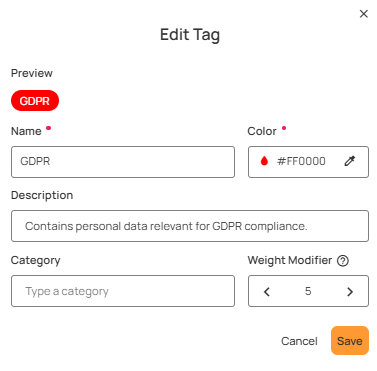
Tag-based weighting
The ability to prioritize the most critical fields and weight them more highly in your overall scores can provide a more meaningful score than one where a problem in a critical field is masked by high scores in lots of less important fields.
PDF export
This is a small thing but nice to have. An export capability can allow delivery of your data scorecard contents to executives or data owners who aren’t users of the data management platform.
Your scorecard is only as good as your rules
The most perfect scorecard in the world cannot help you if it doesn’t sit on top of a mature, well-maintained, high-coverage set of tools. If you are still writing rules manually, lack a centralized library to manage and reuse them, or have no systematic way to discover what rules your data actually needs, you likely don’t have the appropriate coverage needed for your scorecard results to be meaningful.
The Qualytics data quality management platform can help you increase your data quality maturity to get the most value out of your scorecard. Qualytics offers data profiling and automated rule inference that can cover ~95% of the checks your data requires across five tiers of complexity before you write a single custom rule. A centralized library where checks are authored, inferred, versioned, and retired ensures consistent standards across datasets and prevents duplicate effort across teams.
When your rules are comprehensive, consistent, and continuously maintained, your scorecard results become meaningful, and you can start using them to drive real improvement.
Best practices for rolling out a data quality scorecard
Follow these practices for success.
Focus on what’s most critical first
When you first bring a data quality scorecard to your organization, it may feel overwhelming. Start with your most critical data domains (using tags to define what’s critical for you and weighting fields accordingly), and establish a baseline score before setting goals and working on improvements. You may find it helpful to set score targets per domain rather than a single company-wide number, at least at first. Assign ownership of scorecard sections to the appropriate data stewards.
Keep an eye on anomaly trends
Once you have a scorecard up and running, you should review anomaly trends weekly and check coverage at least monthly. This helps you get the bigger-picture view that you might miss if you’re only responding to real-time anomaly alerts.
Monitor scan and profiling activity
Figure out what scan and profiling cadence is appropriate for your data, then watch your scorecard to ensure that it happens as scheduled.
The right scan cadence depends on three questions:
- How fast does your data change?
- How quickly does a quality problem become a business problem?
- What is downstream?
For data that feeds real-time or daily operational processes, you’ll want scans running as frequently as data arrives: at least daily. Slower-moving reference or archival data may need less frequent attention.
Be sure to re-profile on a regular schedule (consider quarterly to start) and whenever you have reason to believe the underlying data has changed materially, since your inferred rules are only as good as the profile they were generated from.
{{banner-small-1="/banners"}}
Last thoughts
A data quality scorecard makes “data quality” a measurable operational metric. Its value increases over time as baselines are established and trends become visible.
Rule coverage and management are critical to ensuring that the scores your scorecard displays actually reflect the quality of your entire data estate. A tool like the Qualytics data quality platform can help you by profiling your data and automatically inferring most of the rules you need. It will also manage a centralized rule library, run periodic scans, and alert your team when anomalies are detected. It provides scorecard views and customization options to highlight the information you need to document and improve your organization’s data quality.
When all of these pieces come together, your data quality scorecard becomes the operational backbone of a data culture your entire organization can trust.
Chapters
Improving Data Governance and Quality: Better Analytics and Decision-Making
Learn about the relationship between data governance and quality, including key concepts, implementation examples, and best practices for improving data integrity and decision-making.
Data Quality Checks: Tutorial & Automation Best Practices
Learn the fundamentals of data quality checks, like structural and logical validation, monitoring data volume, and anomaly detection, using practical examples.
Data Quality Assessment: Tutorial & Implementation Best Practices
Learn systematic approaches to assess data quality using automated tools and best practices for reliable validation.
Data Quality Dimensions: A Complete Guide with Examples
Learn the eight data quality dimensions every data engineer needs to ensure reliable, accurate data pipelines.
Data Quality Scorecard: Dimensions, Granularity, and Best Practices
Learn how a data quality scorecard helps you measure, track, and improve your organization's data quality.
What to Look for in Data Quality Software: A Guide to Features
Learn which data quality software features help teams build and sustain scalable, automated quality programs.
From Reactive to Reliable: A Guide to Modern Data Quality Frameworks
Learn the six core components of a data quality framework and how they work together to ensure reliable data.
Data Quality Automation: How Modern Platforms Validate at Scale
Learn how automated data quality platforms infer validation rules, detect anomalies, and support remediation at scale.
Data Validation Software: 10 Must-Have Features to Look For
Learn how to evaluate data validation software using 10 must-have features for scalable, automated data quality.
The Data Quality Maturity Model: A Six-level Model for AI Readiness
Learn the six-level data quality maturity model that maps your organization's path from ad hoc fixes to proactive AI-augmented governance.
Data Quality Metrics Examples: The Complete Guide
Learn how to turn abstract data quality dimensions into computable, actionable metrics that catch pipeline failures and data errors before they become incidents.
How to Choose the Best Data Quality Tools for Your Team: Key Features and Benefits
Learn what modern data quality tools do, why they matter, and how they use AI and automation to keep your data trustworthy.