Learn how automated data quality platforms infer validation rules, detect anomalies, and support remediation at scale.
Table of Contents
Like this article?
Follow our monthly digest to get more educational content like this.

Script-based validation fails at scale. When enterprises process terabytes of data across hundreds of pipelines daily, manual scripts can’t maintain data quality. Engineers find schema drift after failures downstream, hear about volume drops from stakeholders who want to know why dashboards show zeros, or see quality issues when executives question wrong revenue numbers.
Data quality automation continuously profiles data, sets baselines, and flags potential issues before they occur. Most validation rules (90-95%) are automatically derived from data patterns, with only unique business rules requiring manual checks.
In this article, we explore how modern data quality platforms automate validation at scale. You'll see how systems continuously profile data and infer checks, automated workflows detect and remediate issues, and natural language agents integrate with quality infrastructure across your data stack.
Summary of key data quality automation concepts
What data quality automation actually means
Data quality automation helps teams move beyond static rules or simple monitoring. Instead of setting up validation logic by hand or just monitoring pipeline health, these platforms continuously profile your data, learn what’s normal, and automatically flag anything unusual. This helps fix real problems that can disrupt data systems, like these:
- Schema drift breaking downstream applications
- Late-arriving data causing stale reports
- Inconsistent formats from multiple sources causing integration failures
- Volume anomalies that indicate data flow problems
- Conflicting business definitions producing incorrect BI dashboards
Automation infers most validation rules by analyzing historical data, thereby reducing the need for manual rule creation. For example, value ranges like “retail_price: $0.01–$199.99” are learned automatically. The remaining 5-10% of rules need human input for unique business logic. Automation handles the scale, and engineers add the right context.
{{banner-large-1="/banners"}}
Core pillars of an automated data quality strategy
Automated data quality stands apart from manual methods in five main ways, which are discussed below, followed by a summary table.
Profiling, baseline, and automated rule generation
Platforms profile your data at varying levels of detail, analyzing distributions and setting flexible baselines. Distributed profiling (like Spark-based engines) can handle billions of rows by using configurable sampling. Instead of checking entire datasets, the platform looks at samples that exhibit accurate patterns, keeping things fast at scale.
After profiling, platforms use inference to automatically generate validation rules. Modern platforms like Qualytics provide profile operations with inference thresholds that control automatic check generation:
- Level 0: No inference; manual control for explicit rule definition
- Level 1: Basic integrity like completeness, non-negative numbers, and date ranges
- Level 2: Value ranges and patterns like date, numeric, and string validations
- Level 3: Time series checks and comparative relationships between datasets
- Level 4: Linear regression analysis and validation across different data stores
- Level 5: Most comprehensive; validates distribution shape patterns in data
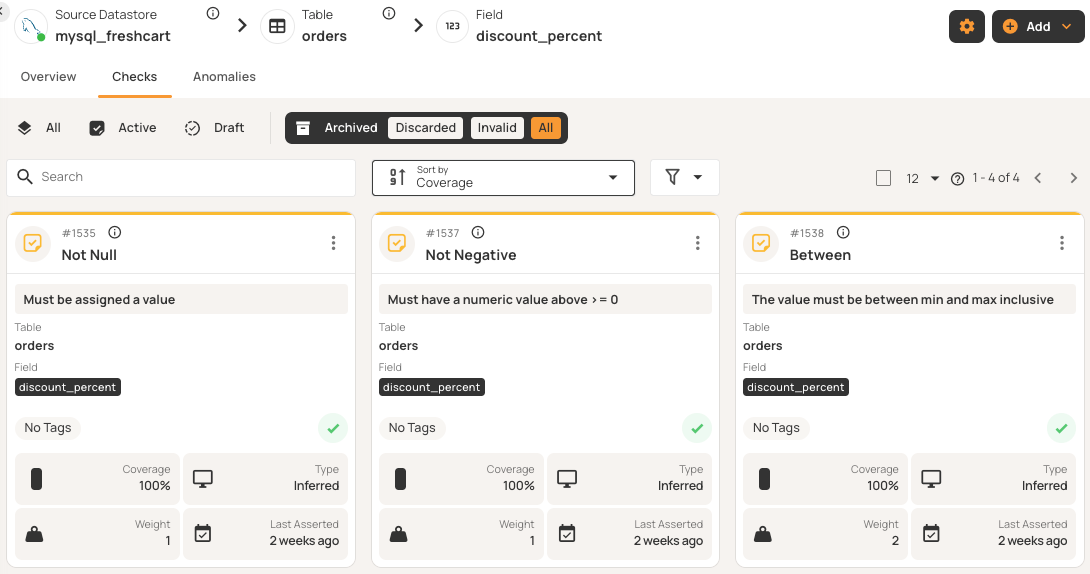
For example, after profiling a discount_percent field, the system can automatically add checks for valid percentage bounds (0-100%), non-null values, and non-negative values. You just review these suggested checks instead of writing them.
The platform sets baselines based on your historical data and adjusts thresholds as patterns change. It uses statistical analysis to define normal ranges using percentiles rather than fixed limits, enabling it to spot anomalies when values deviate from expectations.
This layered approach automates 90-95% of checks, with simple checks at lower levels and more complex patterns at higher ones. Only the last 5-10% need manual review for business-specific logic.
Rule lifecycle management
Validation rules are managed in a single place and can be reused across different datastores. Checks generally move through these three main lifecycle stages:
- Draft: Rules under development, not asserting against data
- Active: Production rules executing in scans, generating anomalies when violated
- Archived: Deprecated rules retained for audit trails
Inferred checks start as drafts, allowing users to review and approve rules before they execute against data. Once active, users can mark anomalies as false positives. After the first invalid mark, the system downgrades the check. After a few false positive marks, the system automatically disables that check and archives the check entirely, learning that it doesn't match actual data patterns.
Beyond inferred checks, platforms provide reusable check templates that act as blueprints for your standardized validation rules. These libraries contain dozens of pre-built templates that cover common validation scenarios, eliminating the need for repetitive rule definitions.
Templates typically have two modes: Locked templates update all related checks automatically, while unlocked templates let individual checks change as needed. For example, if you create a locked template for email format validation and apply it to customer email fields across 10 different tables, updating the template's regex pattern automatically updates all 10 checks simultaneously. Teams can export templates for backup, share them with others, or adapt them for new environments.
Anomaly and change detection
Platforms generally spot two types of anomalies before they affect downstream systems.
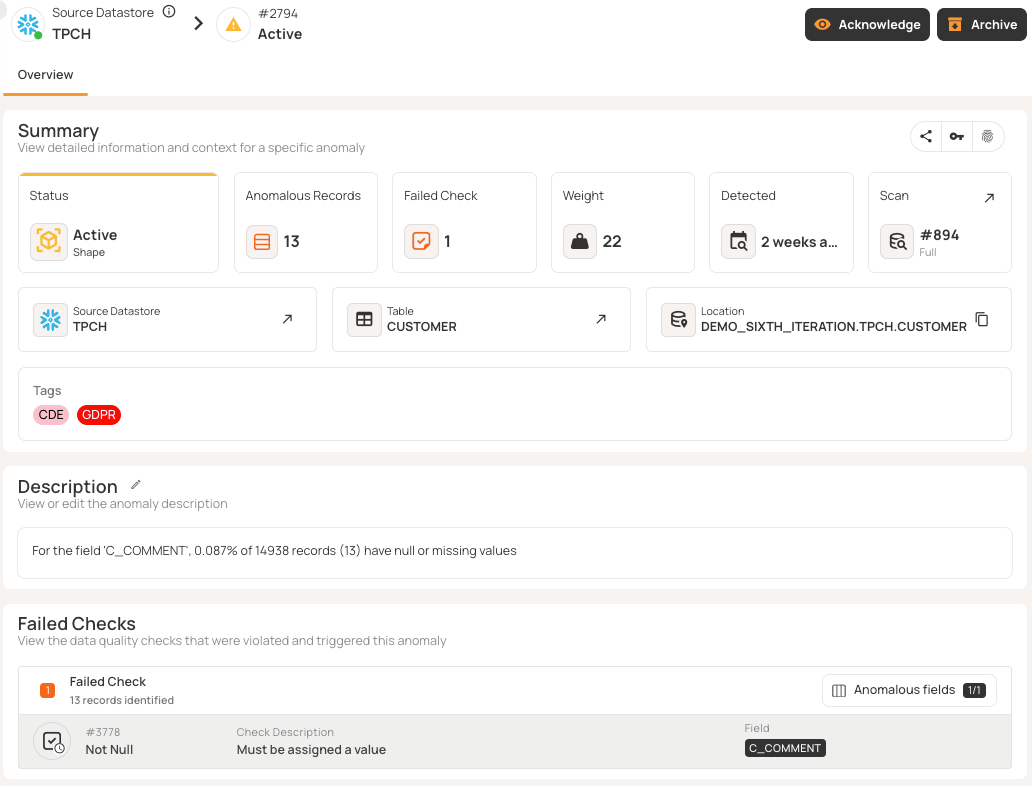
- Record anomalies identify individual rows that fail quality checks, such as missing values, invalid ranges, malformed formats, duplicates, and constraint violations. Examples include negative discount percentages, null customer IDs, or improperly formatted emails.
- Shape anomalies identify structural and distribution issues across datasets, such as missing columns, schema changes, volume changes, and pattern shifts. For example, if a table that usually has two million daily records suddenly shows zero rows, the platform will flag it.
Smart grouping features can help prevent alert fatigue. For example, if there are many null violations in a single data load, the platform can create a single anomaly with a total count and samples rather than sending many separate alerts.
Incremental validation features use timestamp or partition columns to find records that have changed since the last scan. This lets you quickly check millions of new rows without reprocessing the whole dataset.
Triage and ownership
Anomalies typically move through different statuses as they are investigated and teams work toward a resolution:
- Active: Newly detected and awaiting review
- Acknowledged: Issue under investigation with comments and linked tickets
- Resolved: Data issues that are fixed; follow-up scans confirm no violations
- Invalid: Marked as false positives; after few marks, platform modifies or disables the checks
- Duplicate: Linked to original anomaly to avoid redundant work.
Weight-based prioritization ensures that the most important anomalies are seen first. The system decides importance based on check severity (e.g., “critical” adds weight while “low-priority” reduces it), how many records are affected, and how old the issue is. Each anomaly has an owner, severity, and status, making issues clear work items with context and escalation paths.
Remediation and evidence
Fixing quality issues requires automated workflows and detailed audit trails.
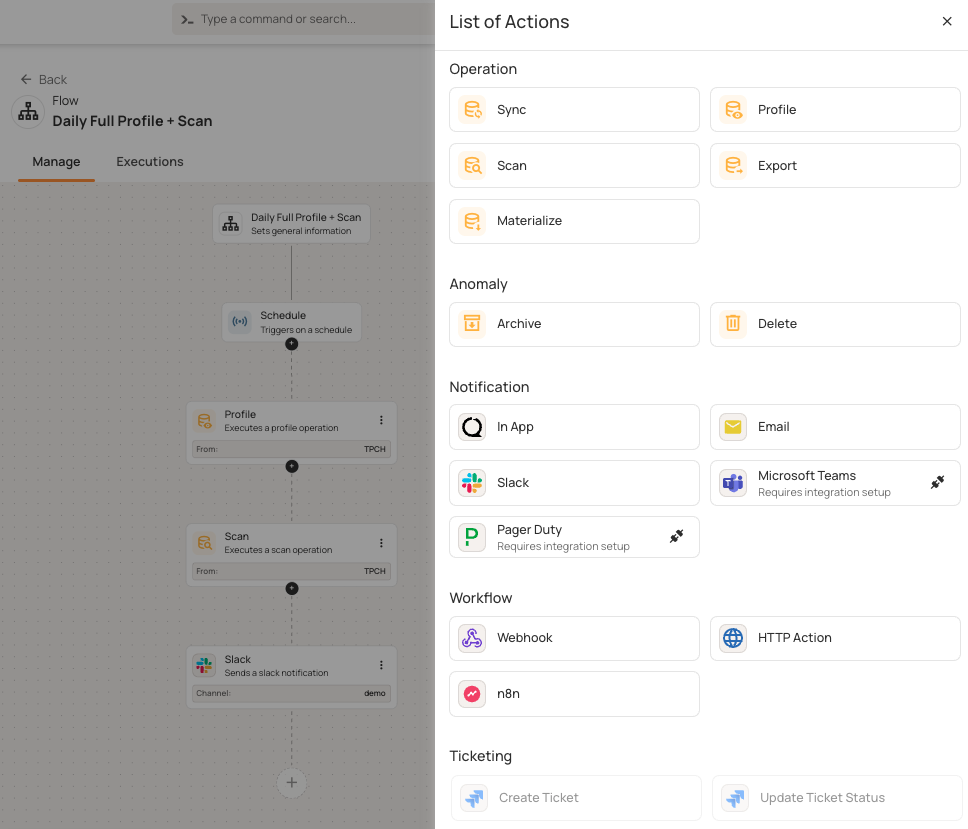
Flows automate responses when certain conditions are met. Each flow has three parts:
- Flow node: Defines the purpose of the flow
- Trigger node: Dictates when to start (e.g., anomaly detected or operation completes)
- Action nodes: Define what happens, such as running operations, sending alerts, or calling external services
When your platform finds an anomaly with a critical tag, flows can trigger several actions. For example, a scheduled flow might start a profile operation, then do a scan, and finally send Slack notifications. Flows can handle operations, send notifications (Slack, Teams, PagerDuty), create tickets (Jira), and use webhooks.
All of these flows and operations generate audit trails and quality metrics. Qualytics saves audit trails and quality metrics to enrichment data stores, such as your own data warehouse. This lets you run SQL-based compliance reports without being tied to a specific vendor.
The post-fix phase is where you actually stop the issue from coming back. For example, if you find an anomaly with 500 null values, you might create permanent checks, add upstream validation, update data contracts, add pipeline tests, or document new procedures. This way, you can catch the same problem in pre-production next time.
Audit trails record every action with timestamps, such as who acknowledged anomalies, when fixes were deployed, and which pull requests resolved issues. Comment threads provide investigation history and audit trails. The evidence, including linked tickets and scan data, is always accessible.
Summary of data quality automation core pillars
The table below compares the approaches described above and shows how automation changes quality management from reactive to proactive and scalable.
Automation in practice: integration, workflow, and programmatic access
Data quality platforms like Qualytics integrate with major data sources (Snowflake, Databricks, PostgreSQL, S3, and BigQuery), automatically discovering schemas and tracking changes.
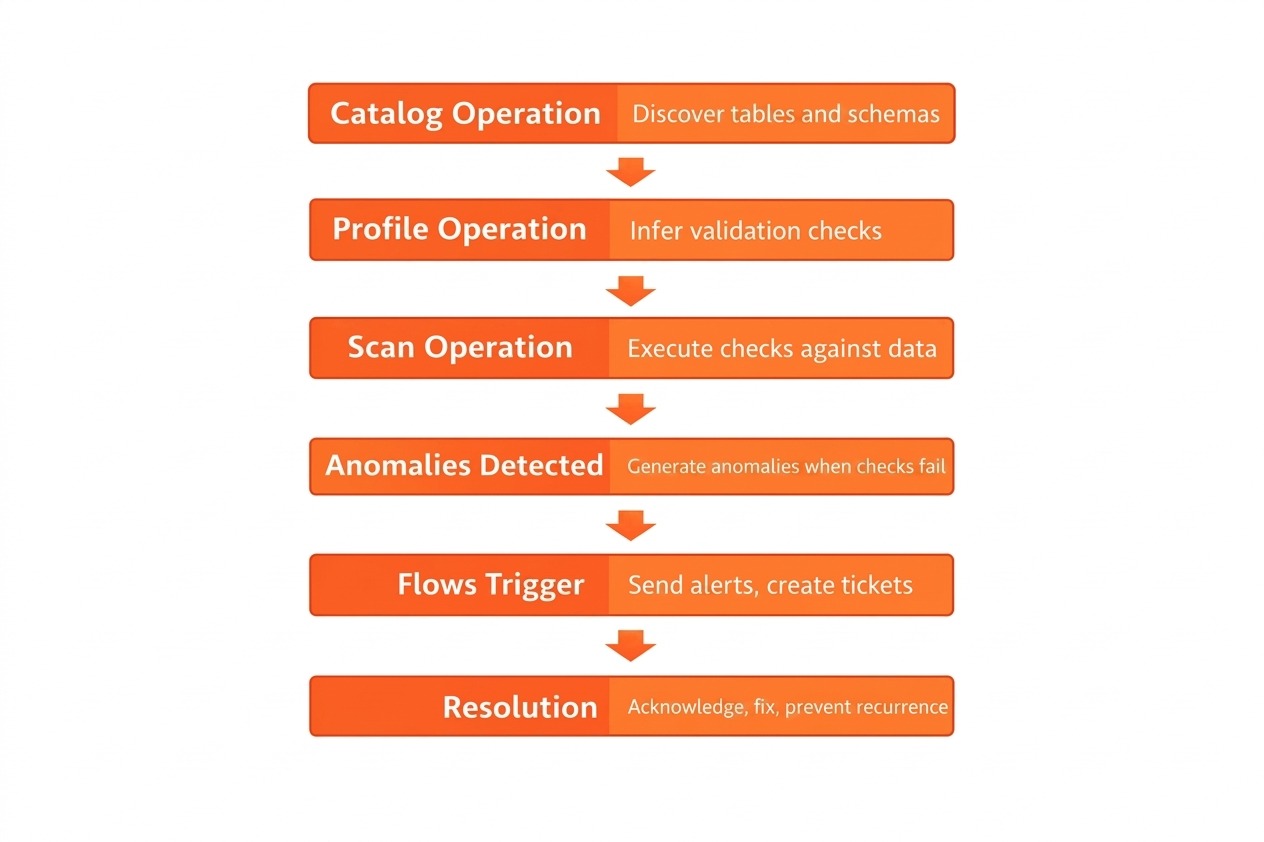
The core operations that form the foundation of automated validation are cataloging (discovering tables and schemas), profiling (inferring validation checks), and scanning (executing checks against data). Run a profile weekly as your data changes, and scan hourly or after data loads. These operations can run at the source before data is ingested, during pipeline transformations, or after data is loaded into your lakehouse.
These operations chain into a complete workflow: anomalies detect trigger automated flows that send alerts and create tickets, leading to resolution.
Quality metrics and audit trails are written to enrichment datastores (within your own data warehouse), enabling custom SQL-based compliance reporting without vendor lock-in.
REST APIs let you automate tasks like querying quality scores, triggering operations, and getting anomaly details. You can also add validation to CI/CD pipelines to stop deployments when data quality drops below set thresholds.
Agentic APIs provide natural language interfaces that work with several LLM providers, including OpenAI, Anthropic, Google, and Amazon. This lets you query your quality infrastructure using everyday language as follows:
curl -X POST "https://your-qualytics.qualytics.io/api/agent/chat" \
  -H "Authorization: Bearer YOUR_QUALYTICS_TOKEN" \
  -H "Content-Type: application/json" \
  -d '{
    "messages": [{
      "role": "user",
      "content": "Which tables have the most active anomalies right now?"
    }]
  }'
Model Context Protocol (MCP) servers securely make this infrastructure available to AI assistants. Your agents can explore datastores, analyze trends, and trigger operations without direct access to the data, making runtime decisions based on the current quality state within flexible workflows.
Automation patterns across use cases
Validation automation works across your entire data lifecycle. Here are recommended best practices for getting the most out of your automation across six key stages: validating at ingestion boundaries, scanning after ETL transformations, monitoring continuously for drift, reconciling during migrations, detecting distribution changes in ML pipelines, and enabling runtime quality checks for AI agents.
Pre-ingestion validation
Use automation to check data before it enters your systems. Automate schema checks for incoming IoT sensor streams or API responses, and immediately reject bad temperature readings or missing device IDs. As an example, financial systems can now pre-screen file formats from payment providers, catching errors before the data even starts loading. This way, you catch issues at the source instead of hours later.
Post-ingestion validation
You can run automated scans after your ETL jobs finish. For example, healthcare systems check patient records after nightly loads to find missing fields or duplicate medical record numbers before staff use the data. You can schedule scans right after data loads. If Snowflake finishing at 3 AM is your baseline, running automated checks at 3:30 AM gives your team a head start: Engineers get alerted to issues well before the morning rush.
Continuous monitoring
You can set up automated scans every hour using incremental validation, which checks only new or changed records instead of whole tables. Your ecommerce platform can keep an eye on order tables, catching payment issues within minutes. Retail inventory tools are built to automatically track updates store-wide, even when you're dealing with thousands of locations at once. This approach scales to billions of rows by quickly checking millions of changes.
Reconciliation checks across systems
Use automation to perform consistency checks during data migrations. If you’re moving financial data from mainframes to the cloud, automated reconciliation compares the source and target systems to find missing transactions or changed amounts. Platforms can show side-by-side comparisons. Manufacturing systems can also automatically reconcile production data between the shop floor and ERP platforms.
ML data drift detection
You can set up automated monitoring for data distributions in your training data. For example, if your retail recommendation model sees customer purchase patterns changing, like mean order value rising from $45 to $62 or null rates going from 2% to 15%, automated alerts can trigger retraining before accuracy drops. Credit scoring models can also automatically track feature drift in applicant demographics.
Agentic data validation before use at runtime
AI agents can check data quality automatically before using it. For example, healthcare diagnostic agents can ask quality APIs if patient data is fresh, complete, and passing checks. If quality is low, agents can ask for manual entry instead of moving forward. Customer service chatbots can also check if the knowledge base is up to date. Agents make decisions at runtime based on the current data quality.
AI-ready foundations and the future of data quality automation
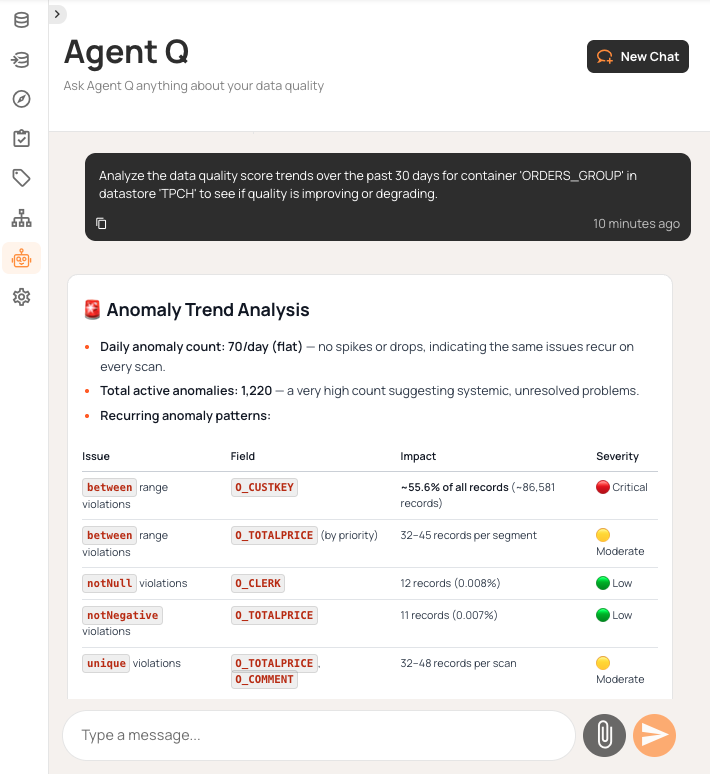
Natural language interfaces change how you work with data quality systems. Platforms like Qualytics offer conversational agents, such as Agent Q, that can explore data stores, create quality checks, investigate anomalies, and trigger actions with simple prompts. You can ask about table schemas, look at quality trends over time, create validation rules for certain fields, or check scan results (all without using dashboards or writing SQL queries).
Beyond conversational queries, AI agents can also validate data programmatically. AI agents check data quality before it’s used, making sure BI dashboards and ML models get reliable inputs. For example, when your recommendation engine looks up customer data, agents automatically check for freshness and completeness, blocking unreliable data from reaching production models.
The inference engine keeps learning from your feedback. If you mark anomalies as invalid, the system adjusts its sensitivity and turns off strict checks after several corrections. Automation gets smarter on its own thanks to that feedback loop, so there’s no need for you to keep adjusting things by hand.
This approach brings together three key elements:
- Proactive detection means catching issues before they cause problems.
- Explainable quality means every score can be traced to specific checks.
- Continuous improvement comes from adaptive thresholds and learning from corrections.
Validation becomes an automated system that supports reliable analytics and trustworthy AI results.
{{banner-small-1="/banners"}}
Last thoughts
Data quality automation eliminates manual work that eats up your engineering team’s time. Platforms that automatically infer rules, adapt thresholds, and learn from feedback turn reactive firefighting into proactive governance. Automating 90-95% of validation lets engineers focus on business-specific rules that need their expertise.
Effective automation is really a combination of several moving parts. It starts with progressive inference levels and enriched data stores for SQL analysis, but it also requires smart workflow routing and API access so you can plug it into your CI/CD. With a natural language interface like Qualytics Agent Q, you can just ask about quality trends or investigate anomalies, and it even lets you create checks in a more conversational way.
If you start by profiling your most important tables and enabling high-confidence checks, you can then expand your coverage step by step as you go. Quality will improve over time as inference engines learn from your corrections and as adaptive thresholds adjust to changing patterns. Quality becomes an automated system that protects your pipelines, instead of relying on manual tickets that always need attention.
Chapters
Improving Data Governance and Quality: Better Analytics and Decision-Making
Learn about the relationship between data governance and quality, including key concepts, implementation examples, and best practices for improving data integrity and decision-making.
Data Quality Checks: Tutorial & Automation Best Practices
Learn the fundamentals of data quality checks, like structural and logical validation, monitoring data volume, and anomaly detection, using practical examples.
Data Quality Assessment: Tutorial & Implementation Best Practices
Learn systematic approaches to assess data quality using automated tools and best practices for reliable validation.
Data Quality Dimensions: A Complete Guide with Examples
Learn the eight data quality dimensions every data engineer needs to ensure reliable, accurate data pipelines.
Data Quality Scorecard: Dimensions, Granularity, and Best Practices
Learn how a data quality scorecard helps you measure, track, and improve your organization's data quality.
What to Look for in Data Quality Software: A Guide to Features
Learn which data quality software features help teams build and sustain scalable, automated quality programs.
From Reactive to Reliable: A Guide to Modern Data Quality Frameworks
Learn the six core components of a data quality framework and how they work together to ensure reliable data.
Data Quality Automation: How Modern Platforms Validate at Scale
Learn how automated data quality platforms infer validation rules, detect anomalies, and support remediation at scale.
Data Validation Software: 10 Must-Have Features to Look For
Learn how to evaluate data validation software using 10 must-have features for scalable, automated data quality.
The Data Quality Maturity Model: A Six-level Model for AI Readiness
Learn the six-level data quality maturity model that maps your organization's path from ad hoc fixes to proactive AI-augmented governance.
Data Quality Metrics Examples: The Complete Guide
Learn how to turn abstract data quality dimensions into computable, actionable metrics that catch pipeline failures and data errors before they become incidents.
How to Choose the Best Data Quality Tools for Your Team: Key Features and Benefits
Learn what modern data quality tools do, why they matter, and how they use AI and automation to keep your data trustworthy.