Learn systematic approaches to assess data quality using automated tools and best practices for reliable validation.
Table of Contents
Like this article?
Follow our monthly digest to get more educational content like this.

Data engineers assessing data quality understand that the challenge is no longer about proving the need for high-quality data but rather managing it at scale. The landscape of data quality assessment (DQA) has undergone significant shifts in recent years, transitioning from manual, ad hoc SQL scripts to integrated, automated workflows powered by machine learning (ML) and artificial intelligence (AI). With the increasing complexity of modern data stacks and hybrid on-premises and cloud environments, the priority is to leverage tools that automate the validation steps, saving time and reducing the technical debt associated with maintaining brittle pipeline testing.
This article explores the techniques and best practices for reliably assessing data quality. We explore how to streamline these assessments using tools with built-in and inferred data quality checks. Implementing these automated solutions will let you establish a systematic, scalable approach to data integrity that fits seamlessly into your existing engineering lifecycle.
Summary of steps in a practical data quality assessment workflow
This article describes a four-step workflow to investigate, understand, and monitor your data to improve its fitness for intended use. The table below describes the steps and the key question each seeks to answer.
Defining data quality dimensions
The first step in any data quality assessment is to define what “good” data truly means for your organization. Data scientists often divide data quality into eight core dimensions.
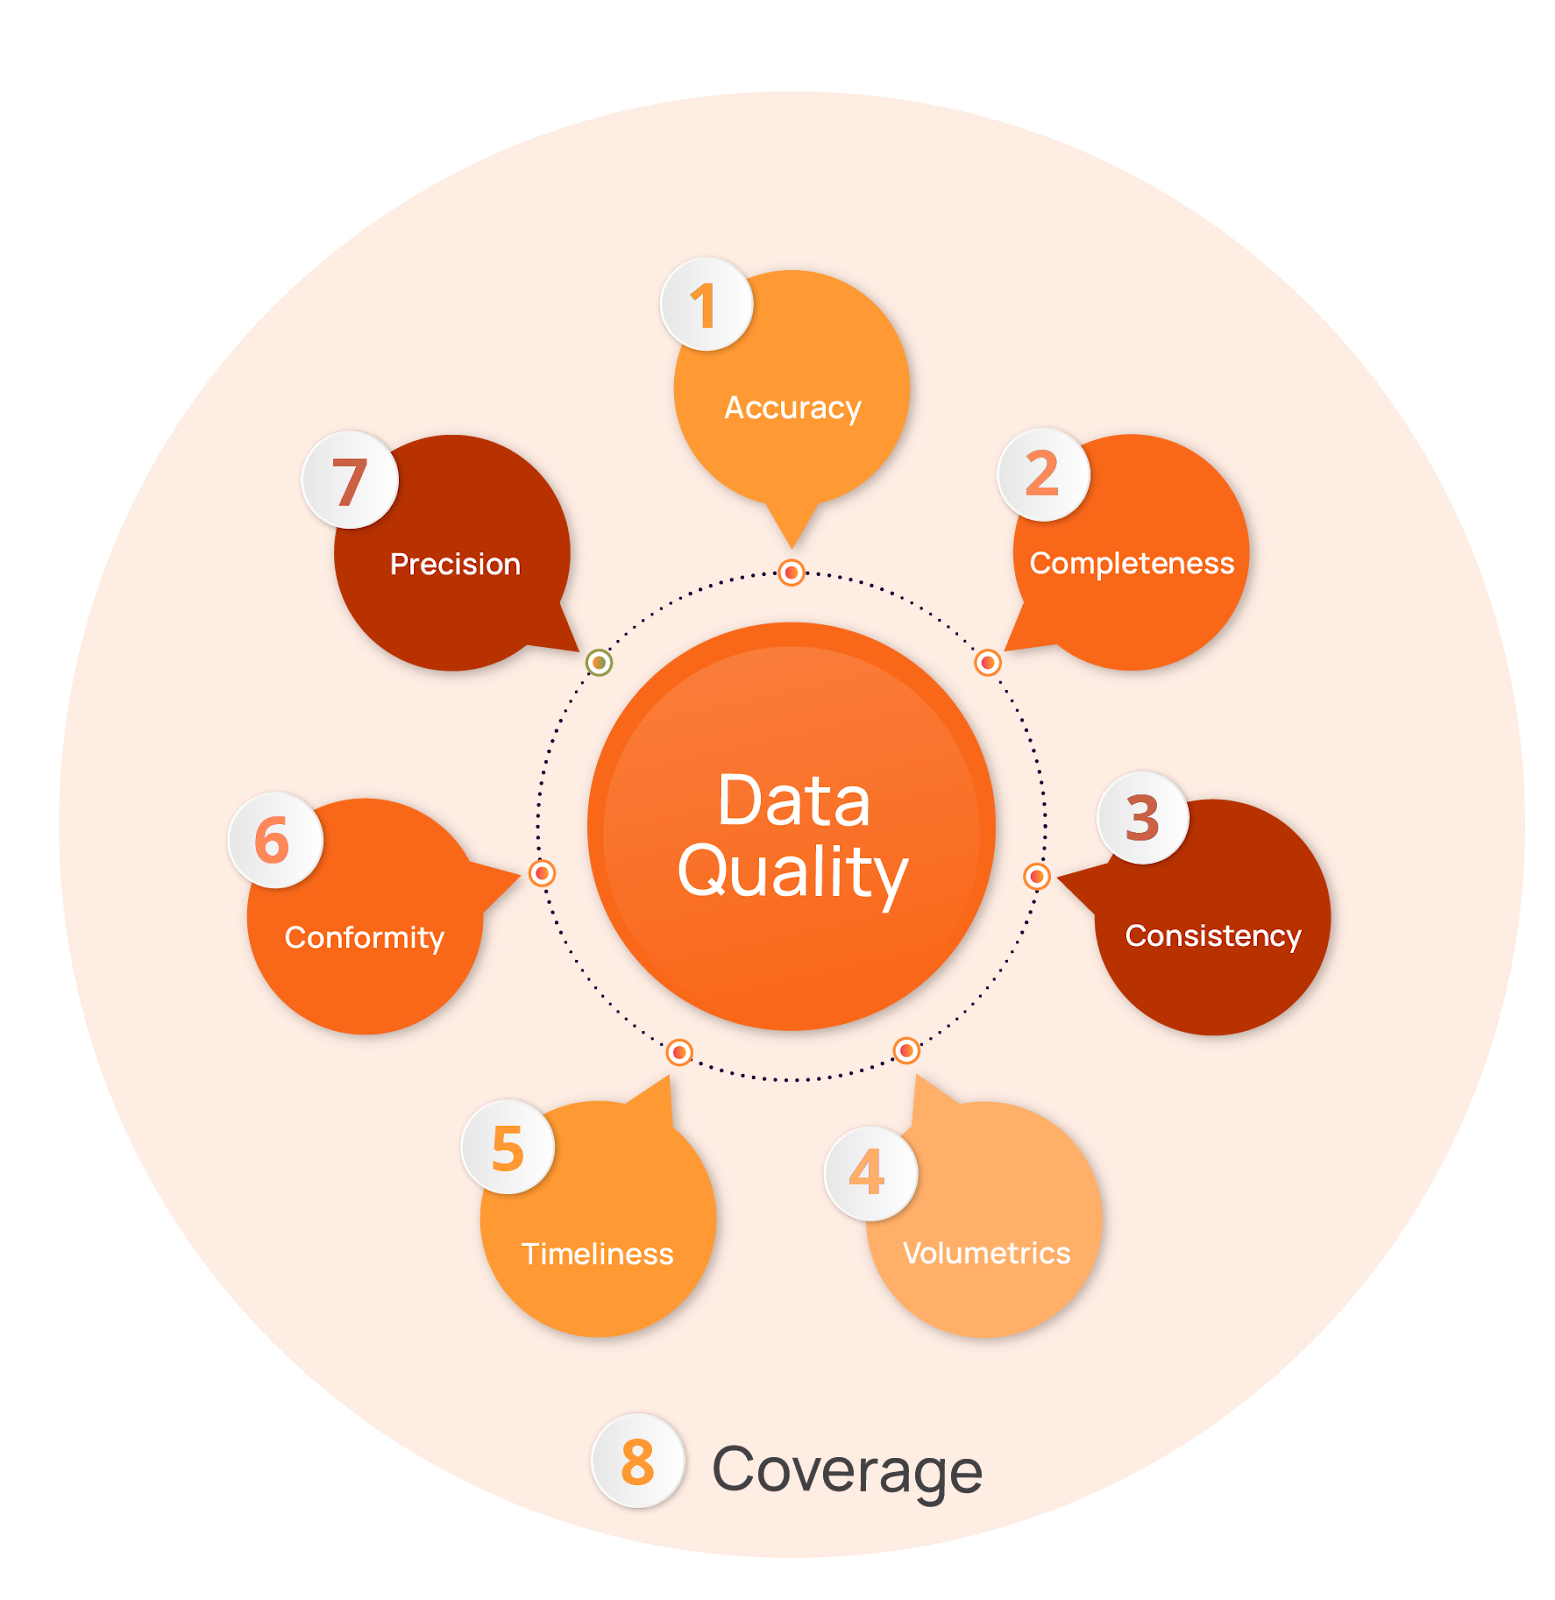
Here’s a summary of the eight dimensions, which are explained in more detail below.
Here is more detail on these eight dimensions:
- Accuracy indicates the degree to which data correctly reflects the real-world object or event it describes. Examples of inaccurate data include a customer record showing a negative sales order value or transactions with future dates. Statistical anomalies can also signal data quality issues. For example, a product weight listed as 1.5 pounds when similar items weigh 1 to 2 ounces. Ultimately, inaccurate data can lead to bad business decisions. For example, it may lead a sales team to make unattainable revenue forecasts.
- Completeness measures the extent to which all required data is present. Product catalog entries lacking key attributes may cause items not to appear in customer searches. An analyst may then draw the wrong conclusions about the product’s lack of popularity, rather than attributing it to missing data. For AI-powered recommendation engines, incomplete product attributes prevent the model from learning appropriate associations between items. This can, for example, lead to the engine failing to suggest additional items a customer is likely to be interested in, resulting in missed revenue opportunities.
- Consistency ensures that data is uniform and coherent across different datasets and systems. For example, when your order table shows transactions for product_id “12345” but your product catalog contains no such product ID, you have a referential consistency issue. If your databases encode the same data differently, such as using full state names in one table while using state abbreviations in another, or store timestamps in UTC in one system but local time in another, you have inconsistencies that can break joins and corrupt aggregate calculations. These issues can result in flawed analytics, leading to reports that don’t reconcile across systems.
- Volumetrics measures whether data has been consistent in shape and size over time, accounting for expected weekly and seasonal variation. Sudden drops, spikes, or structural shifts in data volume can signal upstream failures. For example, if your ecommerce platform typically sees predictable weekend traffic surges, you could miss a data ingestion failure if average daily traffic still seems reasonable but the typical spike is missing. Fraud detection models that assume specific data patterns will also perform poorly when data volumes do not follow seasonal patterns.
- Timeliness reflects whether data is sufficiently up to date for its intended use. If something breaks and your website’s inventory stops updating in real time, for example, you risk selling more items than you have available, eroding customer trust when you have to go back to many of them and tell them that the item is unfortunately out of stock or backordered. Dynamic pricing AI that uses stale competitor data will either price products too high (costing you sales) or too low (sacrificing profits). Stale data may be worse than no data at all for time-sensitive business operations.
- Conformity measures the degree to which data conforms to a defined format and type. Incorrectly formatted data can cause downstream processes to break entirely; even in more robust workflows, it could still be misinterpreted or treated as missing, compromising analyses. For example, in an AI model designed to personalize marketing campaigns, invalid date-of-birth values can degrade model performance and miss targeting opportunities.
- Precision ensures that data meets resolution standards, such as numeric resolution and granularity. When precision is insufficient, small but meaningful changes may be rounded away, leaving insufficient information for properly informed decision-making. Overly coarse sensor data can mask gradual changes and make stable processes appear volatile (a step function rather than a smooth slope). In machine learning models, such low precision can destabilize model training or cause them to miss subtle but important signals, while false precision can lead to overreacting to noise.
- Coverage is a “meta-metric” that measures how well a data field is monitored. Fields that meet the required number of quality checks have a 100% coverage rate, while fields that have no active quality checks running against them have a 0% coverage rate. Fields with little or no coverage can fail silently, creating false confidence that systems are operating correctly. Humans may continue to trust dashboards and reports that appear healthy even though critical inputs are missing, malformed, or drifting. In machine learning pipelines, poor coverage can allow corrupted or incomplete data to be used in training, leading to prediction errors that can be difficult to trace back to their root causes.
{{banner-large-1="/banners"}}
A practical data quality assessment workflow
Traditional approaches to the data quality workflow involve writing custom SQL checks for each dataset, maintaining brittle rule definitions, and manually triaging alerts, but these approaches don’t work well at scale.
Data quality management tools reduce the burden of manually assessing dataset quality. They do this by combining prebuilt validation rules with AI and machine learning technologies that learn your data’s behavior to continuously generate and refine validation logic, detect anomalies, and adapt baselines as your data evolves.
As we will explain in this section of the article, implementing a data quality assessment framework involves a sequential four-step process that moves from initial discovery of your data’s characteristics to active enforcement of your quality guardrails. This ensures that only clean, trusted data flows into downstream applications such as machine learning models and analytics dashboards.
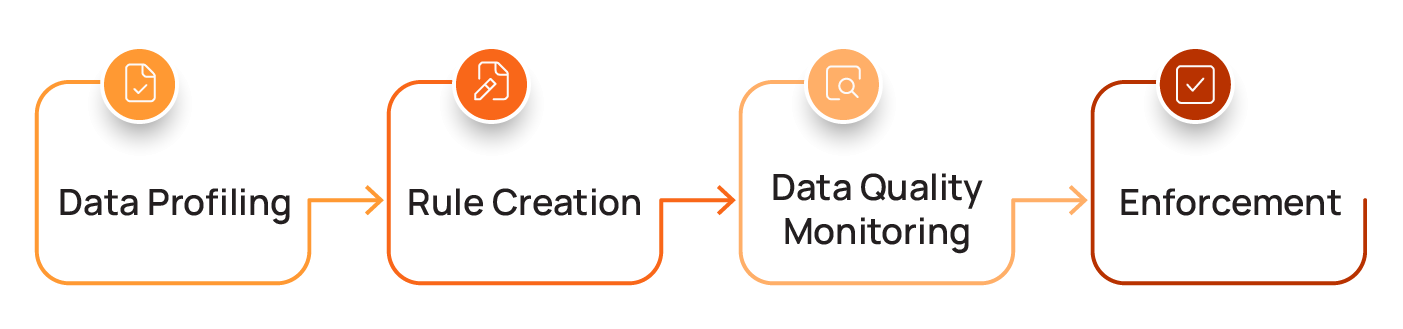
Data profiling: Understanding your data's characteristics
Before you can effectively monitor and enforce data quality, you need to understand your data’s profile. A data profile scan answers this fundamental question: "What does my data look like?" Its objective is to generate a statistical summary that reveals the content, structure, and distribution of your dataset. This scan doesn't judge the data; it simply describes it by providing metrics such as these:
- Volume: The total number of rows
- Content: Data types, null value percentages, and the most frequent values
- Distribution: For numeric fields, the minimum, maximum, average, and standard deviation
- Structure: Common string lengths and patterns
These insights help eliminate guesswork when building targeted data quality rules.
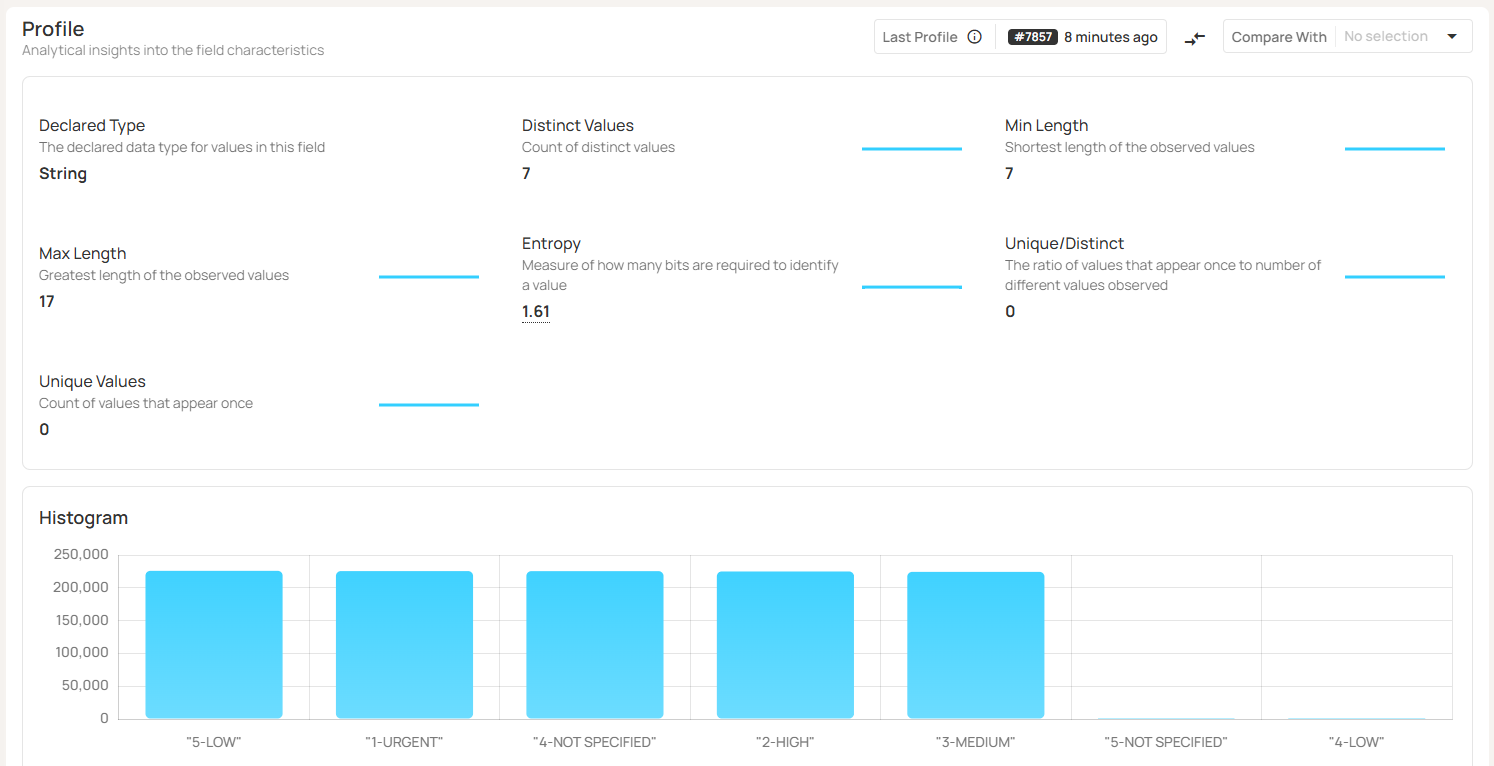
For example, a Qualytics data profile for a categorical field like “order_priority” includes the number of distinct values, number of unique values, string length ranges, and a histogram of values, as shown below:
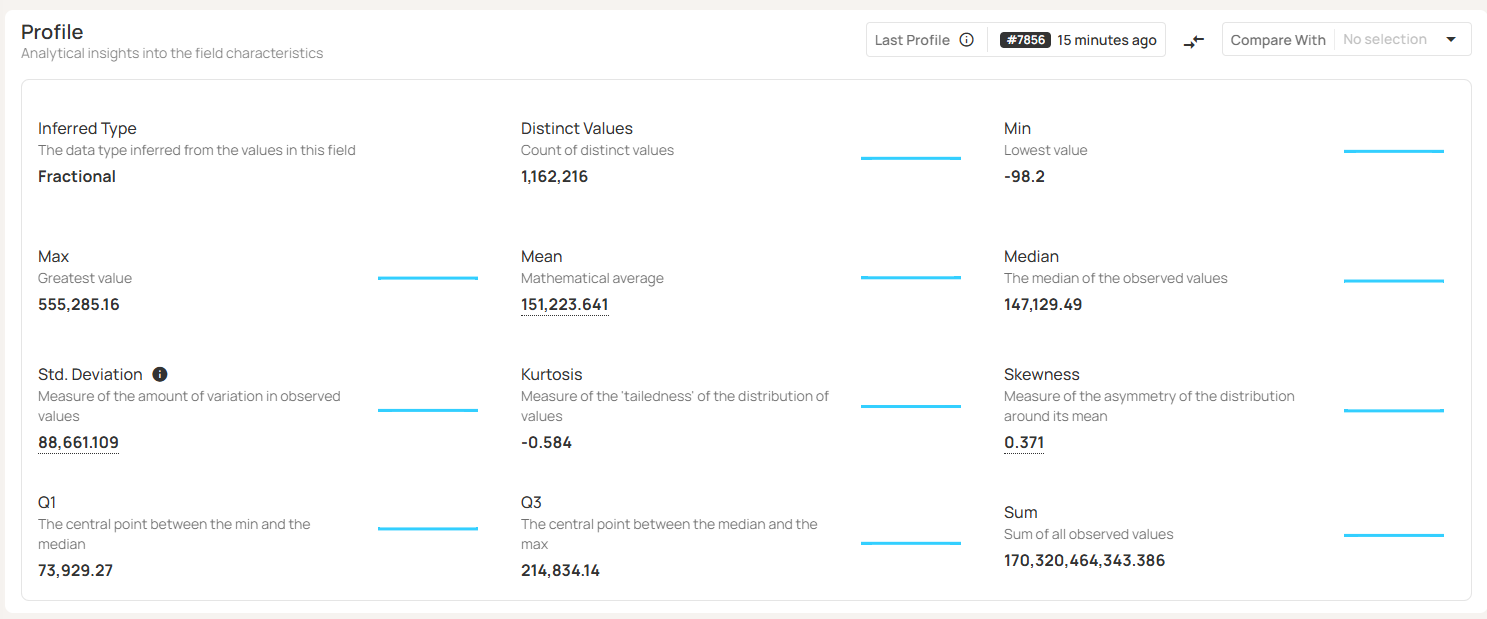
For a numeric field, such as “total_price,” you’d get a statistical analysis of the numeric values, as shown here:
Rule creation: Codifying data quality requirements
Once you know what your data is supposed to look like, you can use the insights from the profile scan to generate rules based on the observed characteristics of your data, and supplement those with custom rules to encode your unique business requirements. Your data quality rules answer the question: “What must my data conform to?”
These rules map directly to the dimensions above; for example:
- Accuracy: product_weight values fall within expected/historical ranges.
- Completeness: customer_id is present and non-null.
- Conformity: customer_email must adhere to a standard email format.
- Consistency: product_id in the order table must exist in the product catalog.
Rules can be hand-written or inferred from your data profile and can range from simple validations to sophisticated ML-powered tools (such as automated anomaly detection) that are designed to detect unexpected deviations in your data. The goal is to enforce technical and business constraints.
A modern data quality management platform, such as the one Qualytics offers, can infer both basic and advanced quality checks based on your data’s profile. The platform’s multi-level inference engine progressively applies more sophisticated validation logic to your data. This typically covers 95% of the most essential checks, including:
- Basic integrity rules (type validation, non-null, simple thresholds)
- Pattern-based rules (email and date formats)
- Temporal and comparative logic (date sequencing and cross-field relationships)
- Statistical anomalies
- More advanced distribution and data shape checks
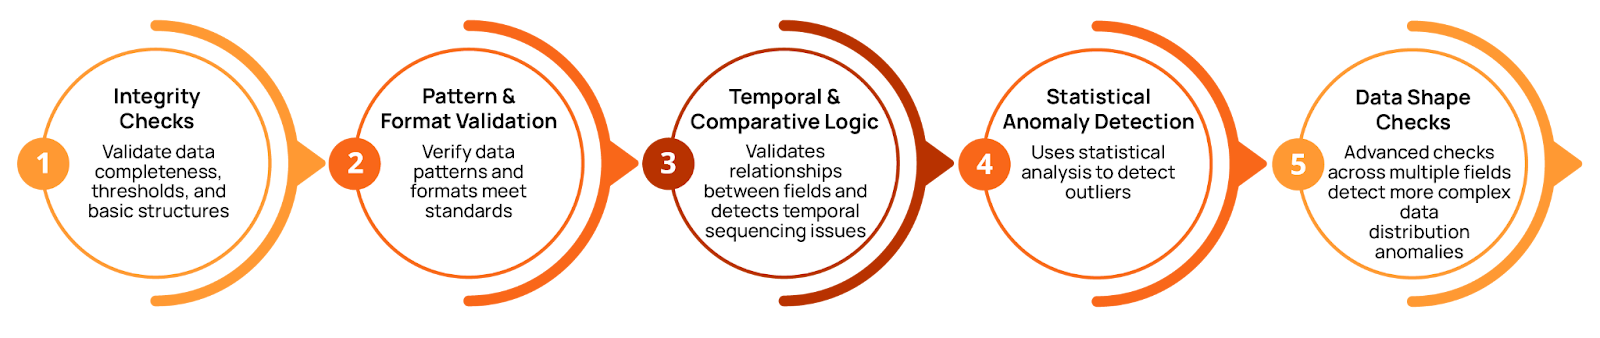
This methodical multi-level functionality, powered by AI-augmented rule generation, enables significant efficiency gains while ensuring broad coverage. Instead of manually defining checks for every type of anomaly in every field of every table in every dataset, the platform automatically proposes quality checks based on what it discovered during the profiling step.
Users can choose to introduce automation gradually, starting with basic level 1 checks and progressively enabling more sophisticated validation (levels 2-5), as shown in the figure above. The system learns your team’s unique requirements: When you mark inferred rules as unhelpful or invalid, Qualytics improves its recommendations, resulting in fewer false positives.
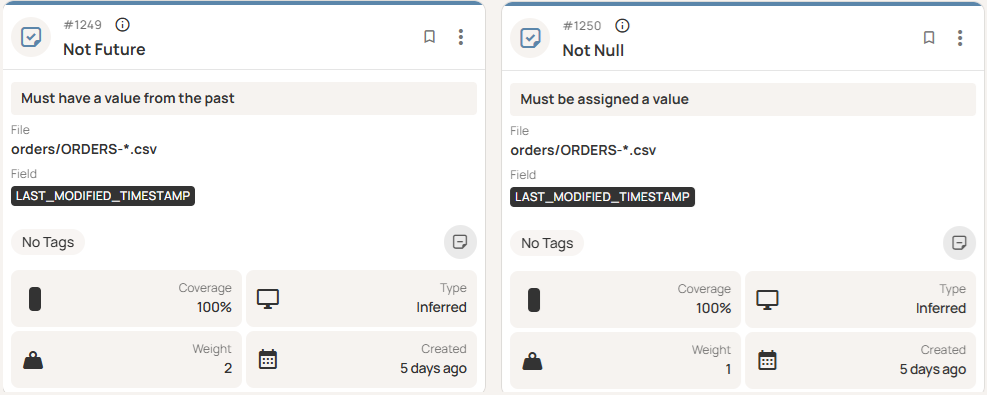
For instance, at level 1, the platform inferred some simple checks on a timestamp field, requiring that it be non-null and not in the future, as shown here.
Data quality monitoring: Validating your data's integrity
Once rules are defined, continuous automated scans validate data against these rules every time new data is ingested or new data assets are created. A data quality scan answers the business-critical question: “Does my data meet our requirements?”
Quality scans should be integrated directly into your data pipeline. Rather than running quality checks as an afterthought or via manual inspection, incorporating them in your pipeline ensures that validation happens automatically and consistently with every data ingestion or transformation. Incremental scans process only newly added or modified data, making this cost-effective even at scale.
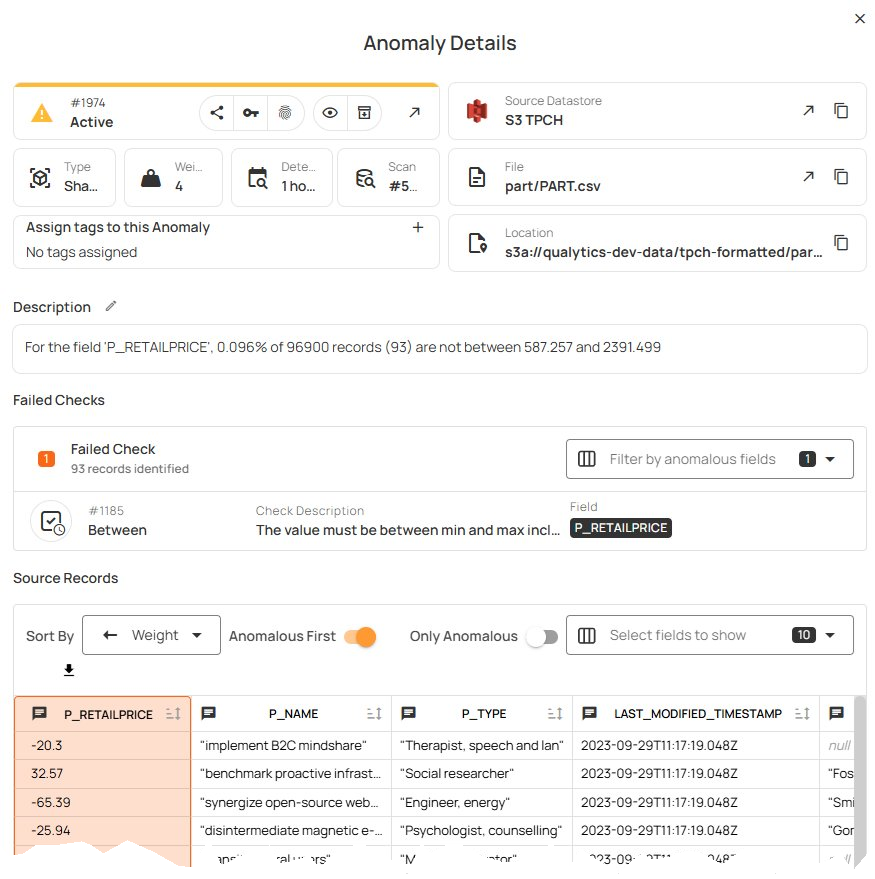
When a scan runs and finds items that do not satisfy your rules, anomalies are created for your review. For instance, this scan found that a small percentage of the “P_RETAILPRICE” values were outside of the expected range.
Qualytics also provides advanced data observability features to monitor data freshness and volume, ensuring data timeliness. Here we see an example where the “ORDERS” volume falls below an inferred threshold.
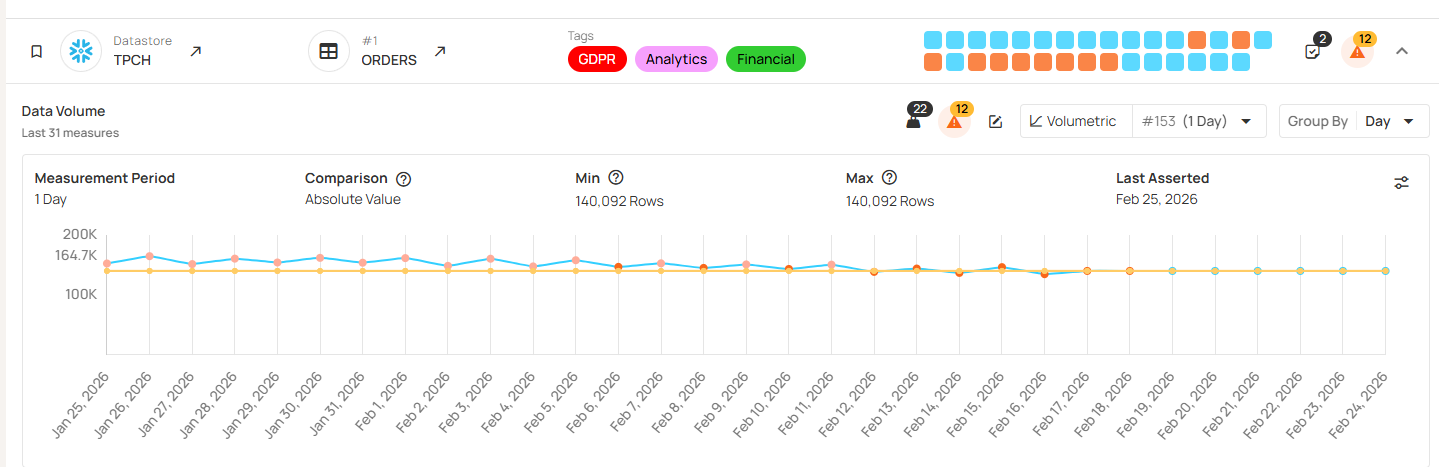
The platform can also infer appropriate volumetric checks from historical data, including weekly or seasonal variations. Rather than alerting on static thresholds, the platform can learn your data’s natural patterns and flag relevant anomalies while ignoring expected variation. For example, instead of setting static thresholds (like “alert if daily transactions < 5,000”), the system can learn that your pipeline normally processes (for example) 10,000 rows on weekdays but only 3,000 on weekends, so it can automatically adjust thresholds. When Tuesday’s volume drops to 3,000, the system flags it as an anomaly; on a Saturday, that volume would be expected.
Data quality enforcement: Dealing with poor quality data
The output of quality scans is a set of anomalies: data that failed one or more of your defined rules. A remediation process ensures that these anomalies become workflow items that your team acts on rather than just alerts that disappear into logs. An enforcement and remediation plan answers the question: “What happens when there is a problem with our data, and how do we fix it?”
When your quality scan detects issues, predefined actions should trigger based on the check’s severity, protecting the integrity of your downstream processes and analyses. For issues that are safe to correct (for example, cast transformations), you can apply automated normalization. Otherwise, the pipeline should quarantine or reject the affected records or partitions, fail the run or prevent publication, and alert the owning team with enough context to triage and remediate.
A policy model based on severity could look something like this:
- Warn: Log metrics and notify, but allow the run to continue.
- Error: Quarantine the bad slice and publish nothing, or publish only the clean partition.
- Critical: Fail the task and page on-call.
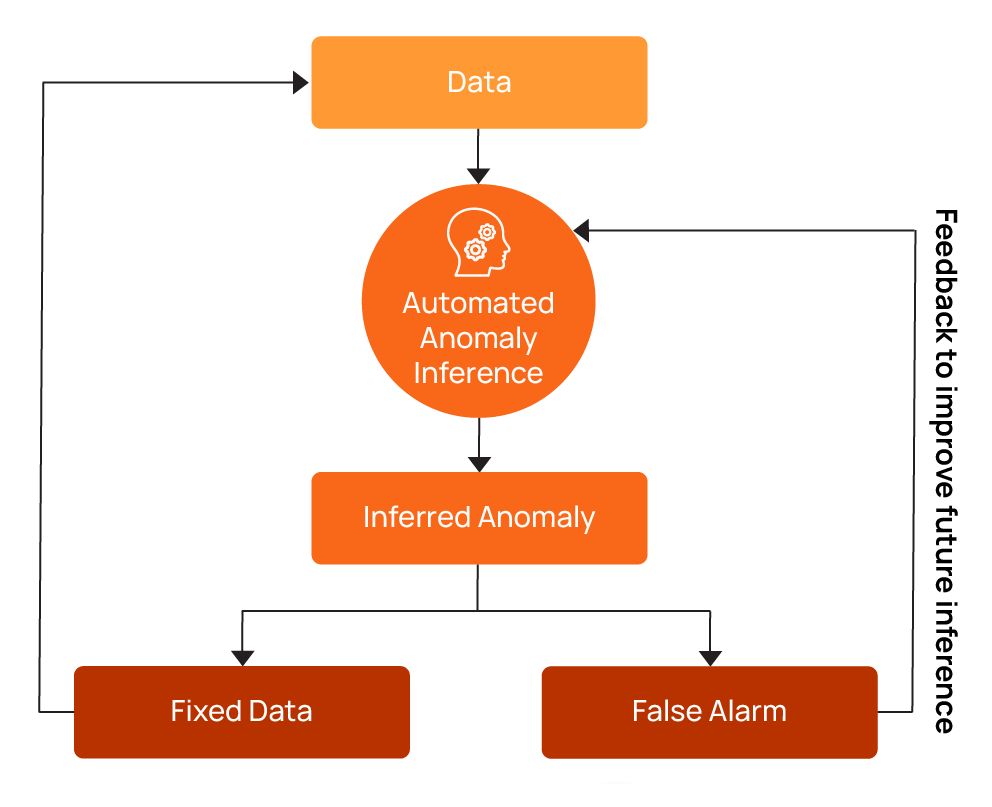
The Qualytics platform treats anomaly remediation as part of an operational workflow. Each alert has an owner, severity, status, context, escalation plan, and auditable history. Team members acknowledge issues to start working on them and can either mark them as invalid or duplicate or work toward a resolution and mark them fixed after resolving the issue. Marking anomalies as invalid provides user feedback that helps train the system to improve future inference (also known as reinforcement learning), reducing false alerts and allowing your team to focus on genuine problems.
{{banner-small-1="/banners"}}
Final thoughts
Building your data quality practice starts with high-level profiling to understand your data’s characteristics. Let automated inference suggest your initial data checks, and supplement these with any more specialized rules that you self-author. Invest in creating centralized rule libraries to prevent teams from duplicating one another’s efforts.
What to implement next: Integrate incremental quality scans into your continuous integration/continuous deployment (CI/CD) pipeline, using the Qualytics REST API and command-line interface (CLI).
What to gate: Gate dataset publishing, partition promotion, and downstream model refresh on passing quality checks so that bad data never reaches production.
What changes day-to-day: Don’t treat data quality assessment as a one-time or periodic audit; instead, treat it as a collaborative, iterative, and continuous operational loop integrated into your existing collaboration and ticketing tools. Qualytics’ team-based notifications can integrate with Slack, Microsoft Teams, Jira, ServiceNow, and PagerDuty, and include impact analysis, priority, operational context, and action items.
What success looks like: Fewer brittle, hard-coded checks scattered across repositories, fewer false alarms eroding engineer trust, faster mean time to resolution (MTTR) when issues do occur, and downstream tables and models that your analysts and stakeholders can rely on because quality is enforced continuously.
Chapters
Improving Data Governance and Quality: Better Analytics and Decision-Making
Learn about the relationship between data governance and quality, including key concepts, implementation examples, and best practices for improving data integrity and decision-making.
Data Quality Checks: Tutorial & Automation Best Practices
Learn the fundamentals of data quality checks, like structural and logical validation, monitoring data volume, and anomaly detection, using practical examples.
Data Quality Assessment: Tutorial & Implementation Best Practices
Learn systematic approaches to assess data quality using automated tools and best practices for reliable validation.
Data Quality Dimensions: A Complete Guide with Examples
Learn the eight data quality dimensions every data engineer needs to ensure reliable, accurate data pipelines.
Data Quality Scorecard: Dimensions, Granularity, and Best Practices
Learn how a data quality scorecard helps you measure, track, and improve your organization's data quality.
What to Look for in Data Quality Software: A Guide to Features
Learn which data quality software features help teams build and sustain scalable, automated quality programs.
From Reactive to Reliable: A Guide to Modern Data Quality Frameworks
Learn the six core components of a data quality framework and how they work together to ensure reliable data.
Data Quality Automation: How Modern Platforms Validate at Scale
Learn how automated data quality platforms infer validation rules, detect anomalies, and support remediation at scale.
Data Validation Software: 10 Must-Have Features to Look For
Learn how to evaluate data validation software using 10 must-have features for scalable, automated data quality.
The Data Quality Maturity Model: A Six-level Model for AI Readiness
Learn the six-level data quality maturity model that maps your organization's path from ad hoc fixes to proactive AI-augmented governance.
Data Quality Metrics Examples: The Complete Guide
Learn how to turn abstract data quality dimensions into computable, actionable metrics that catch pipeline failures and data errors before they become incidents.
How to Choose the Best Data Quality Tools for Your Team: Key Features and Benefits
Learn what modern data quality tools do, why they matter, and how they use AI and automation to keep your data trustworthy.