Learn the eight data quality dimensions every data engineer needs to ensure reliable, accurate data pipelines.
Table of Contents
Like this article?
Follow our monthly digest to get more educational content like this.

The process of ensuring data quality now relies on intelligent, automated frameworks rather than manual validation scripts. Comprehensive evaluation requires systematic approaches that track data correctness, structural relationships, and operational patterns across entire data ecosystems. Data engineers working with complex systems need scalable solutions that address data quality across its distinct dimensions.
In this article, we explore eight core data quality dimensions with practical examples using the example of FreshCart, a fictional grocery delivery service. We demonstrate how modern tools use AI and machine learning to automate validation workflows, reduce technical debt, and ensure data reliability at scale.
Summary of data quality dimensions with examples
Accuracy
Accuracy indicates the degree to which data correctly reflects the real-world object or event it describes, in other words, whether the data that exists is correct. A field can be fully populated yet inaccurate if values don't match their real-world counterparts.
Accuracy violations appear as calculation errors, measurement mistakes, data entry bugs, or system synchronization failures. They can corrupt your financial reports, break business logic, and poison machine learning models trained on incorrect labels.
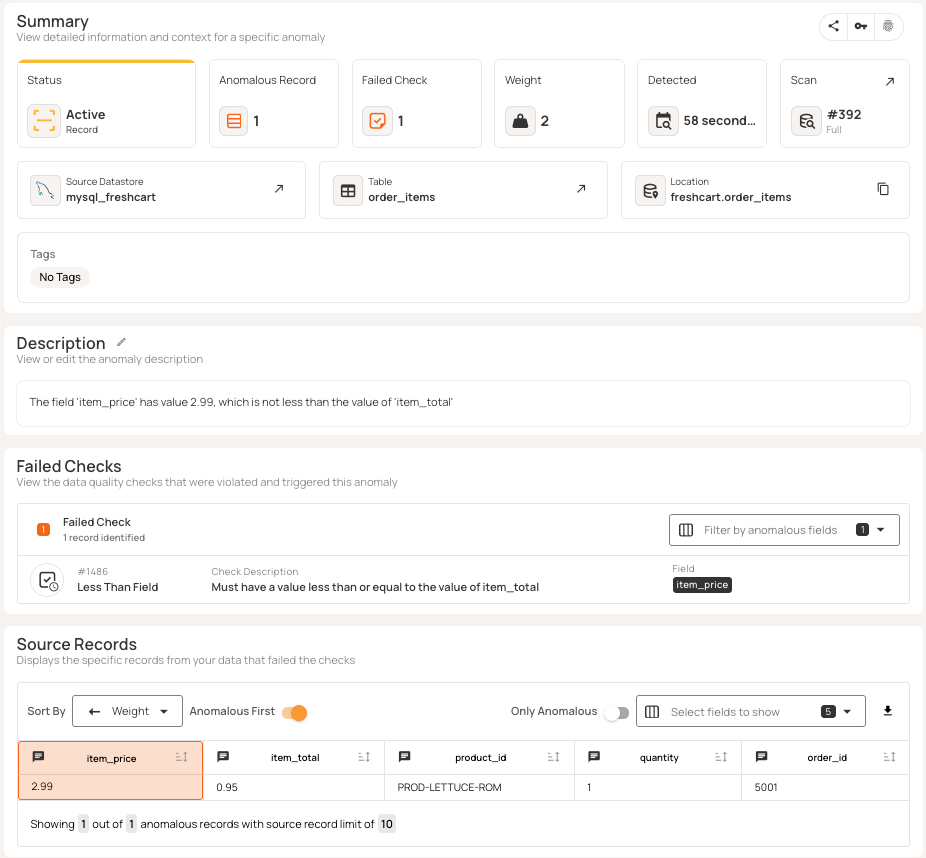
A simple example illustrates this. Consider FreshCart's order line items. The system captures both the unit price and the total for each product. Cross-field validation ensures logical consistency between these values, highlighting problems like the “$0.95” item_total value in the third row below.
Modern data quality platforms such as Qualytics automatically infer logical relationships between related fields during profiling. The incorrect item_total is automatically detected as an anomaly, as shown below.
Completeness
The completeness quality dimension assesses whether datasets have all the needed fields and values. Missing data can make analysis harder and lead to incorrect conclusions, especially if you treat missing values as zeros rather than unknowns.
Completeness works at two levels: missing values in required fields and missing whole records in datasets. Incomplete records can cause your processes to fail or skip important steps. For example, shipping calculations won’t work without product weight, and customer models that omit records with missing data can give a skewed view of the customer base.
Completeness problems often come from form fields, failed data migrations, incomplete ETL jobs, or source systems that stop sending updates. To spot these issues, you should measure how many nulls are in each column and look for missing records in key datasets.
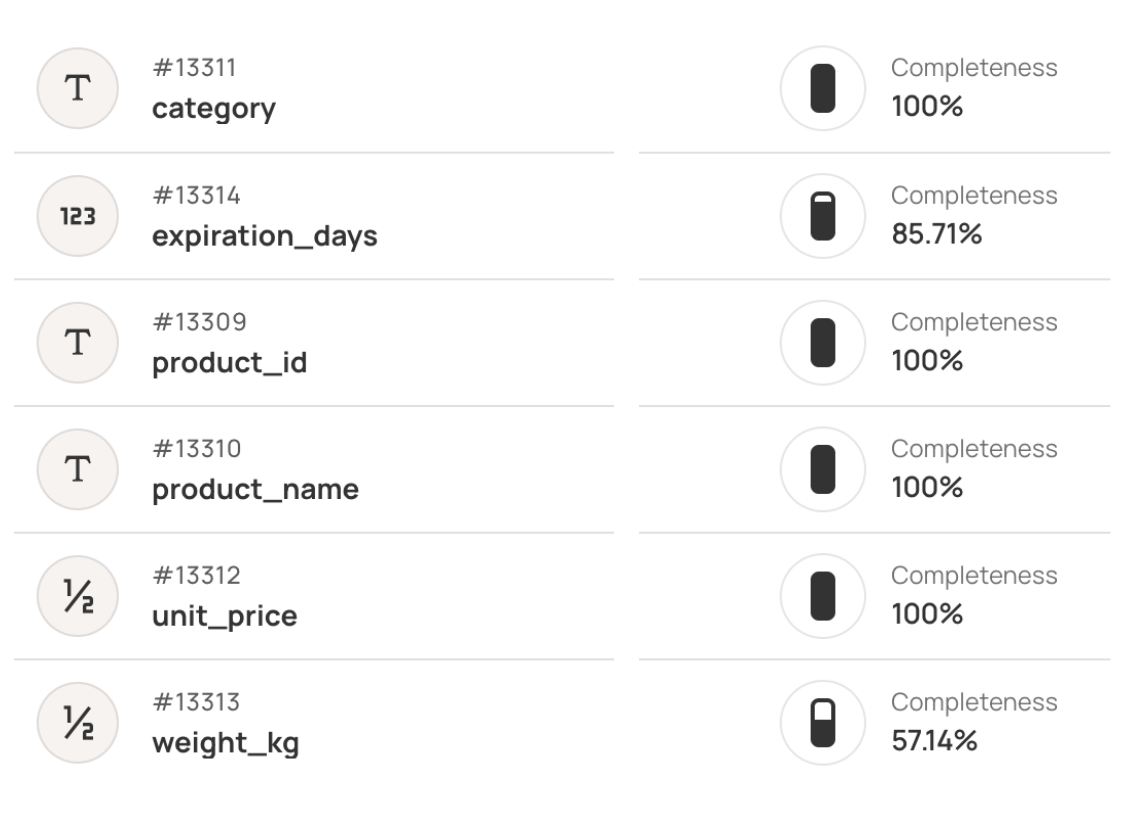
FreshCart's fulfillment system requires weight_kg for shipping calculations and expiration_days for inventory rotation. Missing fields prevent automated processing.
Profiling tools like Qualytics calculate completeness percentages to quantify data gaps across critical fields, as shown in the diagram below.
Consistency
Consistency is all about making sure that data stays the same across different systems and remains stable over time. There are two aspects to it:
- Referential integrity means matching data between systems (like using the same IDs). When it fails, it can break your joins or lead to orphaned records and bad summary calculations. If the same item has different IDs in different tables, reports can’t match up and business rules may fail.
- Temporal consistency refers to making sure field values don’t change in unexpected ways over time. It checks that field values stay within expected patterns as data evolves, and it flags fields that start to drift or change in unexpected ways. Sometimes, a field can keep its links but still drift if its values or formats change.
Detection relies on constraint validation, cross-table joins to identify orphans, and statistical profiling to track changes in value distribution over time.
FreshCart's order fulfillment depends on valid product references. Orders must link to existing products for inventory checks, pricing lookups, and warehouse picking. Consider this Products table and Orders table.
Order 5023 references BANANA-KG, but the Products table uses PROD-BANANA-1KG, breaking the foreign key relationship. This orphaned reference prevents inventory lookups and fulfillment.
{{banner-large-1="/banners"}}
Volumetrics
Volumetrics tracks how much data you have over time to help keep it accurate and reliable. Instead of just counting rows, volumetric checks watch table sizes over days, weeks, or custom periods and flags any odd changes that could indicate data-loading problems or pipeline failures in your systems (or even possible fraud or suspicious activity).
The system sets baseline limits based on your past data patterns, accounting for factors such as day of week, seasons, and business cycles. For example, if today’s row count goes above or below these limits, it triggers an alert. This method can catch problems that averages miss, like when a pipeline processes data that looks fine but is missing most of the expected records or when duplicate processing causes a big spike in volume.
Detection combines automated row counting, rolling averages, and threshold alerts based on standard deviations from expected volumes. These methods make it easier to catch issues before business users notice missing or duplicated information.
In this FreshCart example, the Customers table typically grows by 1-2 registrations daily. When volume jumps from 8 to 111 customers, volumetric monitoring flags the spike as an anomaly. This may indicate unusual or unexpected system activity, requiring further investigation.
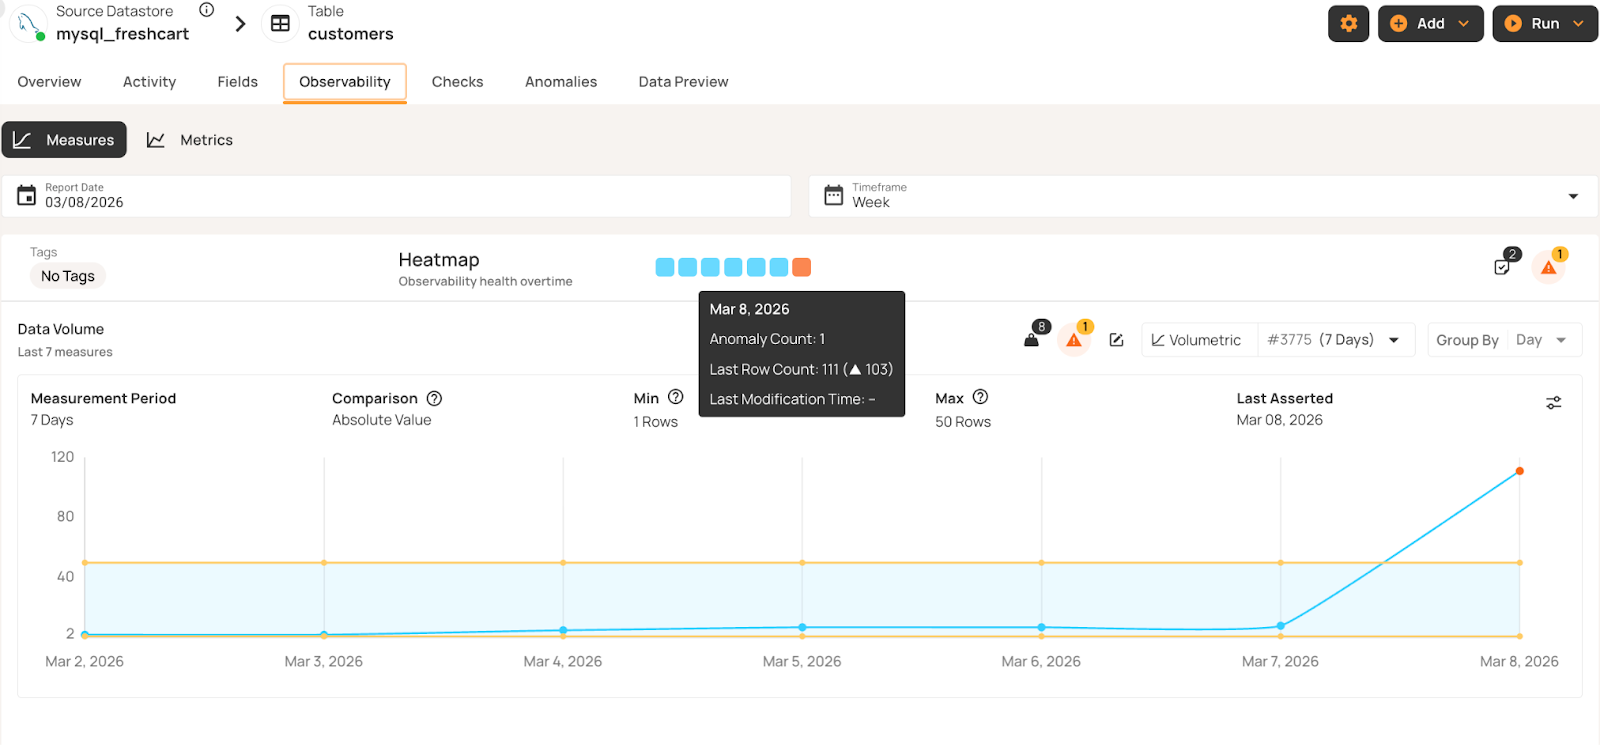
The system automatically inferred this anomaly based on deviations from the 7-day moving average.
Timeliness
Timeliness measures whether data is current enough for its intended use. Especially for time-sensitive operations, stale data can be worse than no data at all, leading systems to operate on outdated assumptions.
Different types of data need to be updated at different speeds. For example, financial trading data must be refreshed within seconds, while demographic data can stay valid for months. Timeliness is also situational: A data point might be fresh enough for one use but too old for another. Inventory timestamps that work for monthly reports may not be good enough for real-time displays.
Timeliness has two aspects: data latency (the time between an event occurring and the data becoming available) and data freshness (how long it has been since the last update). Delays can happen because of pipeline processing issues, failed refresh tasks, missed service-level targets, or network disruptions. To detect these problems, you can track the most recent timestamps in each table, compare them against expected update schedules, and generate alerts when data becomes outdated.
In the FreshCart scenario, outdated inventory information can cause operational problems. The sequence diagram below illustrates this timeliness failure:
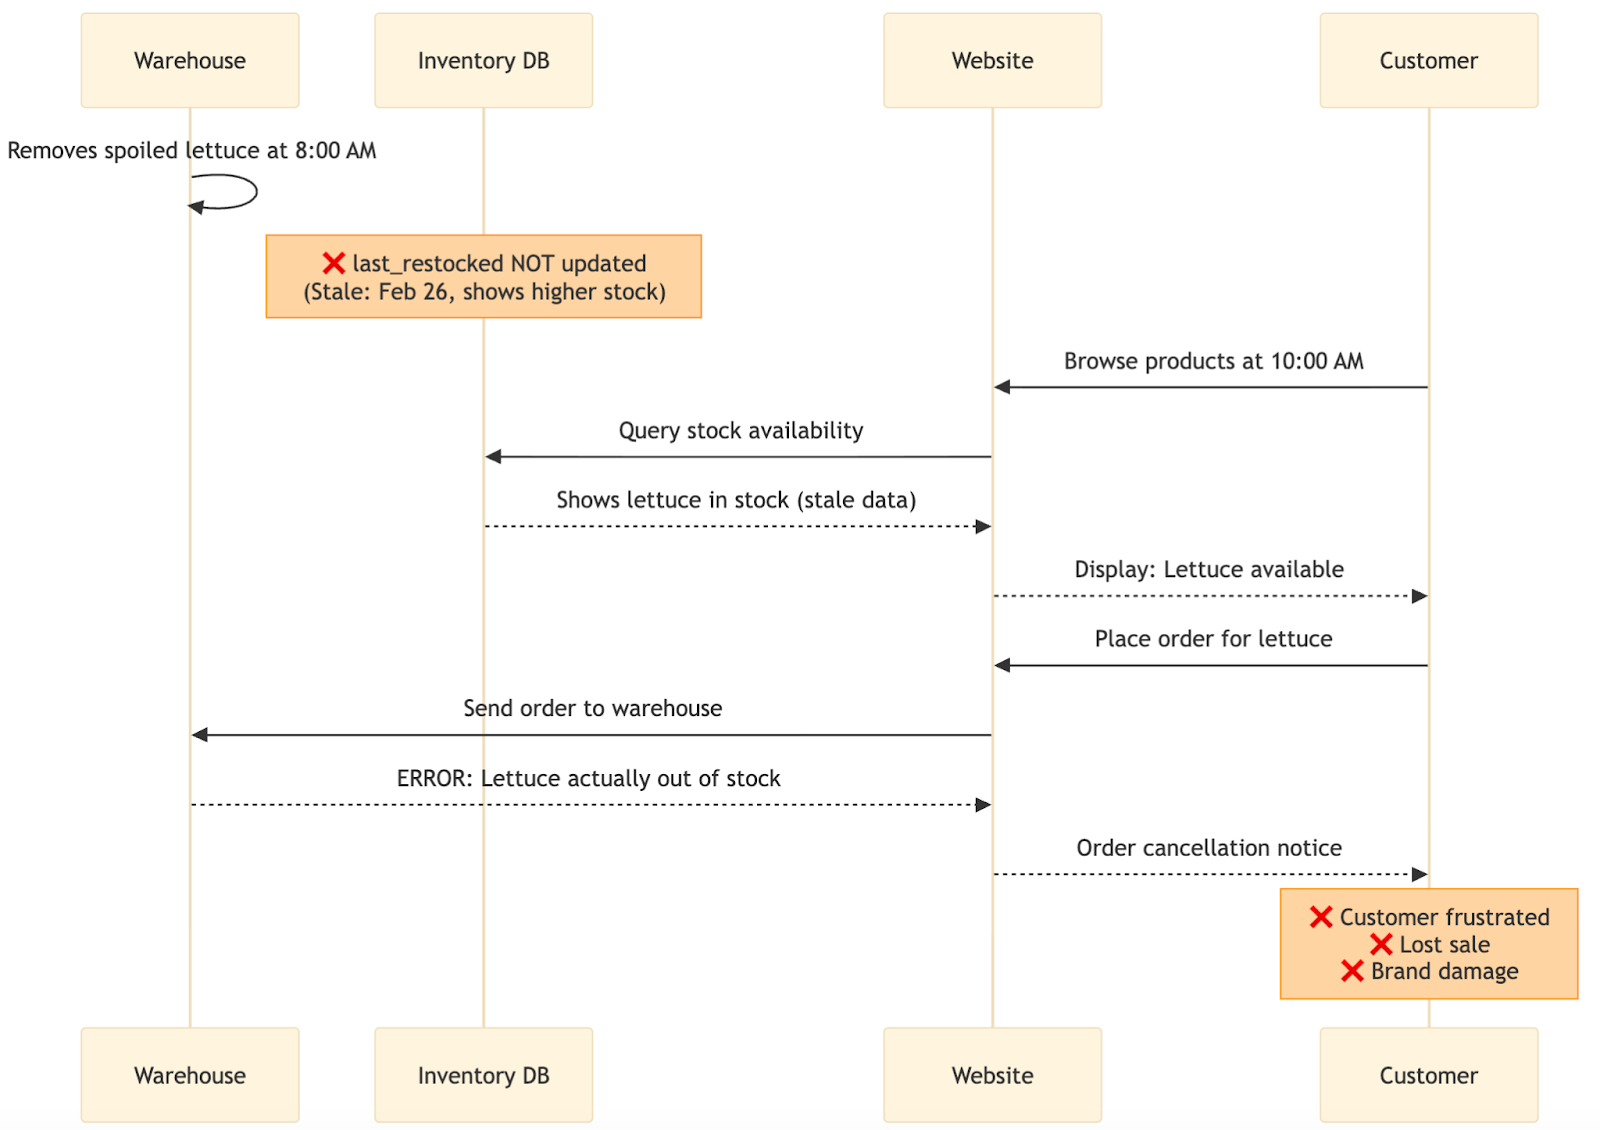
The diagram shows how timeliness failures impact operations. At 8:00 AM, warehouse staff remove spoiled lettuce, but the database doesn't update, still showing the February 26 timestamp with higher stock levels. Two hours later, a customer sees lettuce available on the website and places an order. The system checks the stale database and confirms availability. When the warehouse receives the order, they discover the lettuce was actually removed and is unavailable. The customer gets a cancellation notice, leading to frustration, a lost sale, and potential brand damage.
Conformity
Conformity checks if data follows the right formats, data types, and allowed value ranges. It looks at structure: Does the data match expected patterns, use the right types, and fit within valid limits? For example, a phone number might be correct but not follow the required format, or a date could be valid but stored as text instead of a timestamp.
If data does not meet standards, it can disrupt analysis, cause pipeline failures, and make machine learning systems skip records or crash. Format problems can break joins, create duplicates, and stop automated systems from reading fields correctly. Conformity issues also make it hard to combine systems that need consistent structures.
These problems often come from inconsistent data entry, weak validation, merging datasets with different rules, or changes upstream that break what downstream systems expect.
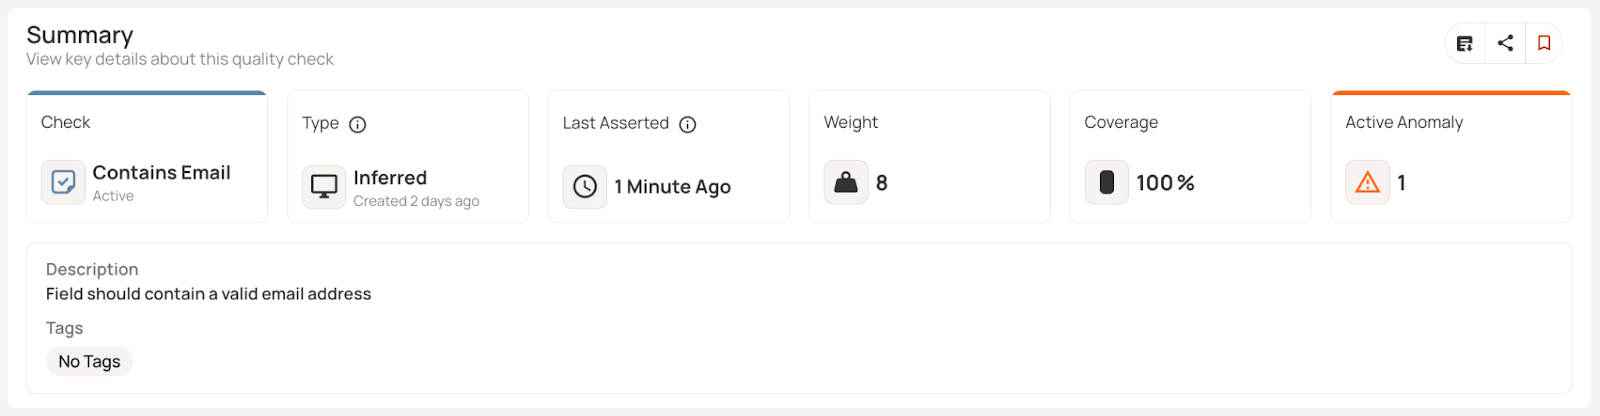
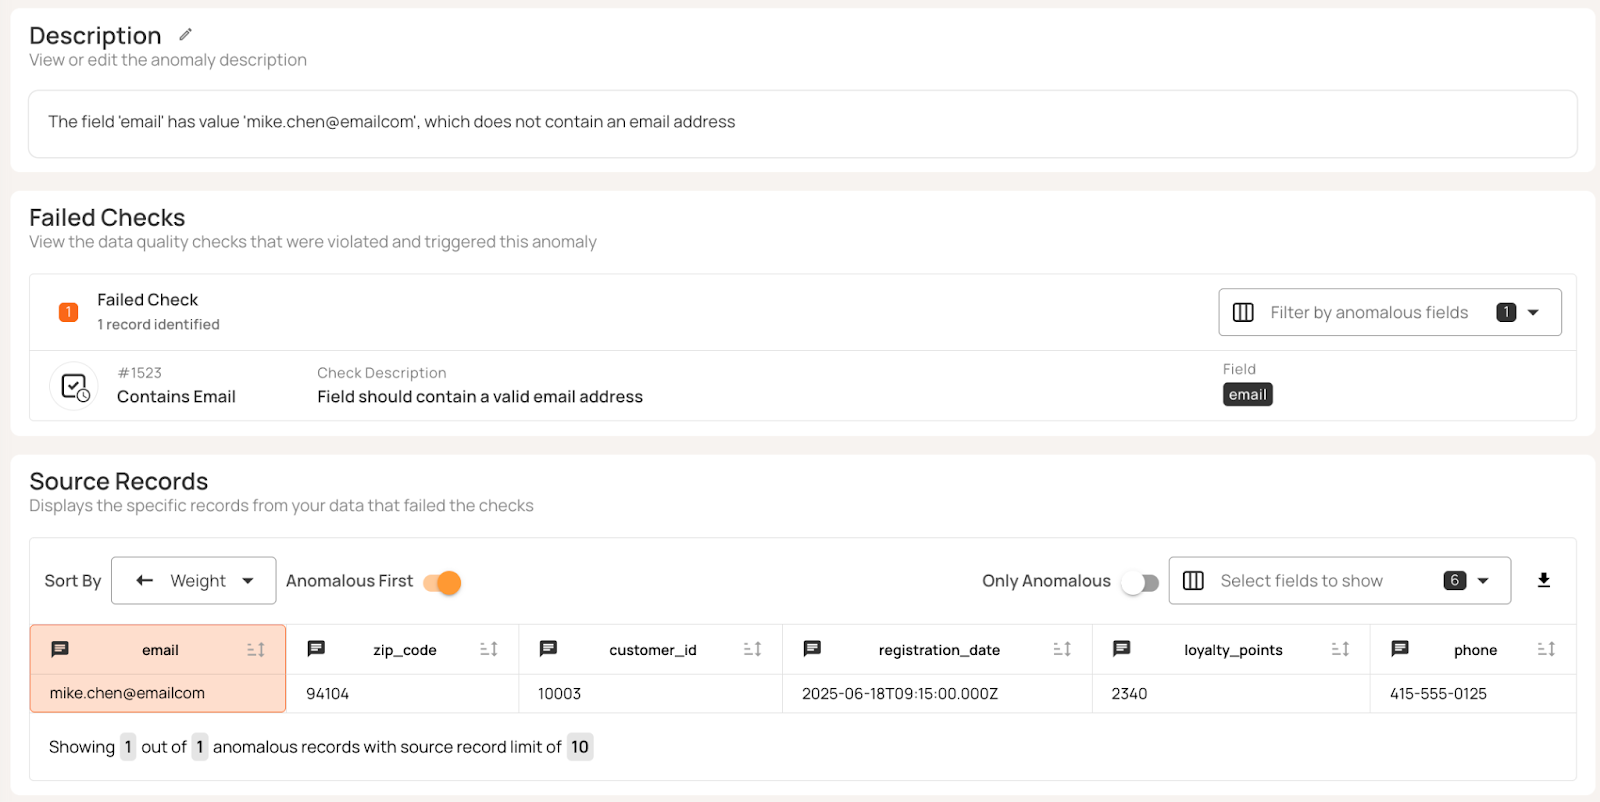
In our example, the Customers table demonstrates issues with conformity across multiple fields. Customer 10002's phone number (415.555.0124) does not meet the specific expected format. Customer 10004 has a 4-digit zip code. Customer 10003's email (mike.chen@emailcom) lacks the standard dot separator for the domain name.
Qualytics automated profiling detects these patterns and flags non-conforming values.
Precision
The precision dimension checks that field values stay within expected limits and rules. While completeness asks if data is present and accuracy asks if it is correct, precision makes sure values fit within set ranges, time limits, and math rules. It also looks at how detailed the data is, making sure measurements are recorded at the right level—not too coarse or too detailed.
Numbers need to stay within valid ranges, dates must follow time rules, and measurements must fit physical or business limits. If these rules are broken, it could mean data entry mistakes, sensor problems, calculation errors, or clock issues. Example problems include ages over 120 years, temperatures outside possible limits, or timestamps set in the future. These problems can ruin analytics by adding impossible outliers, breaking business logic, or causing errors when values go beyond allowed limits.
To catch them, use range checks, comparison operators, math rules, and time boundaries. Modern tools can learn normal ranges from past data and flag values that do not fit specific rules.
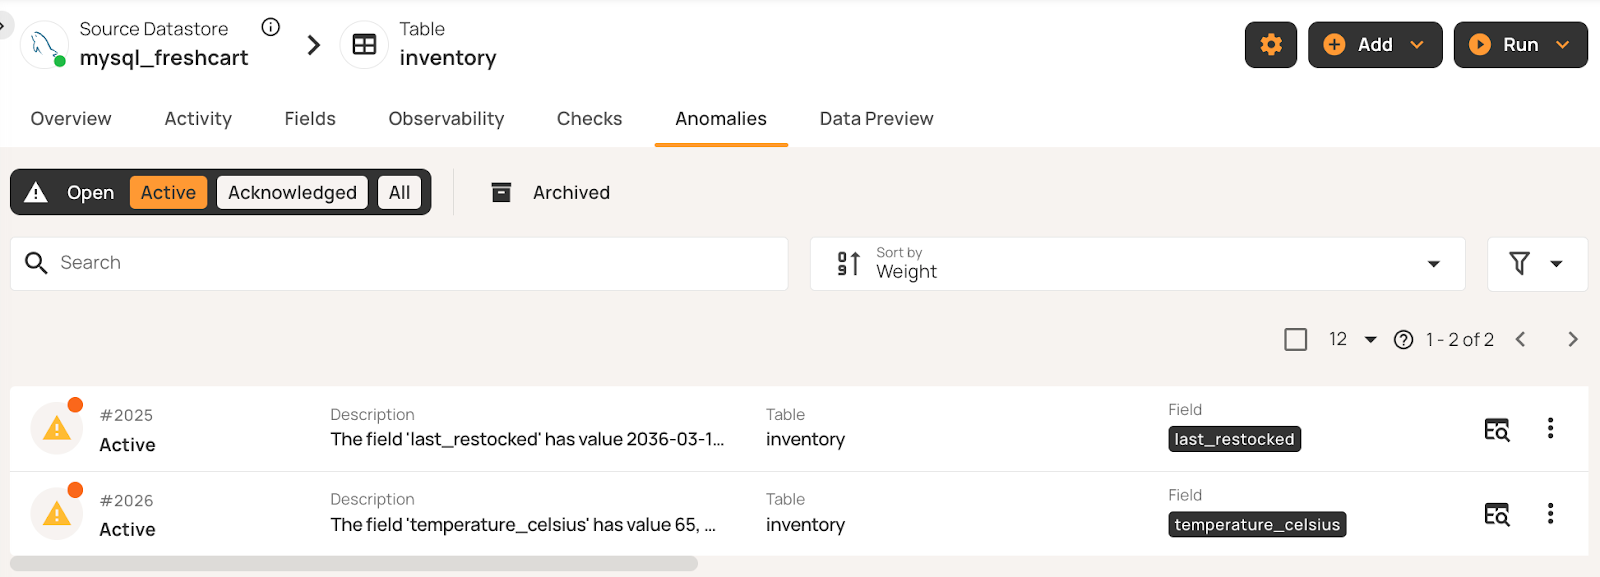
FreshCart's inventory management tracks product restocking timestamps and storage temperatures. Precision checks validate that values fall within acceptable boundaries. For example, in the table below, the last_restocked date in row 3 is 10 years in the future, and the temperature_celsius figure in row 4 is too high.
Automated profiling infers boundary constraints from historical data patterns, flagging values that violate temporal or range limits without manual rule configuration:
Coverage
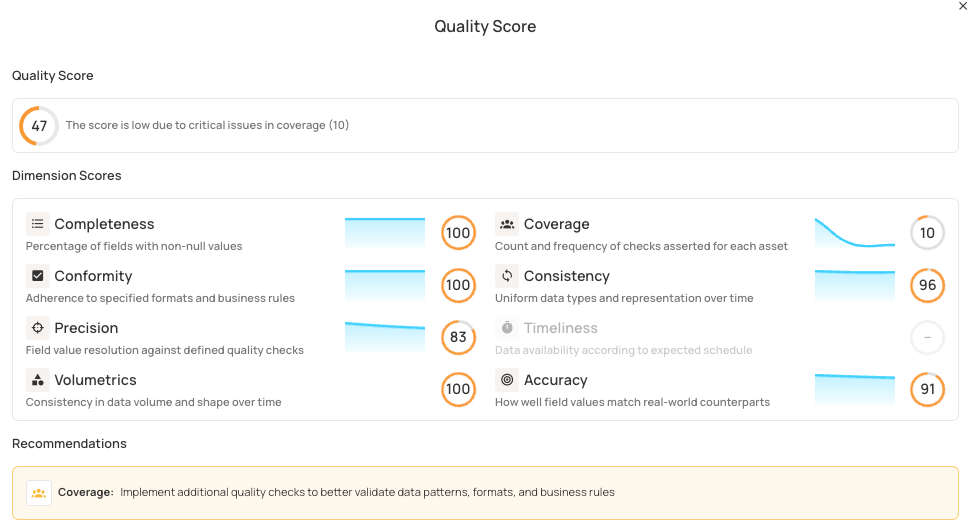
Coverage is a meta-metric that shows how well data fields are monitored. Unlike the other seven dimensions, which measure data quality itself, coverage checks if there are enough rules in place to catch as many problems as possible. It looks at the percentage of fields with quality checks compared to all fields that need them. Fields without sufficient checks can fail quietly, letting errors spread without being noticed.
Coverage gaps often happen with new fields, old columns, or attributes that people think are reliable but have never been checked. Coverage measurement counts distinct quality checks applied to each field.
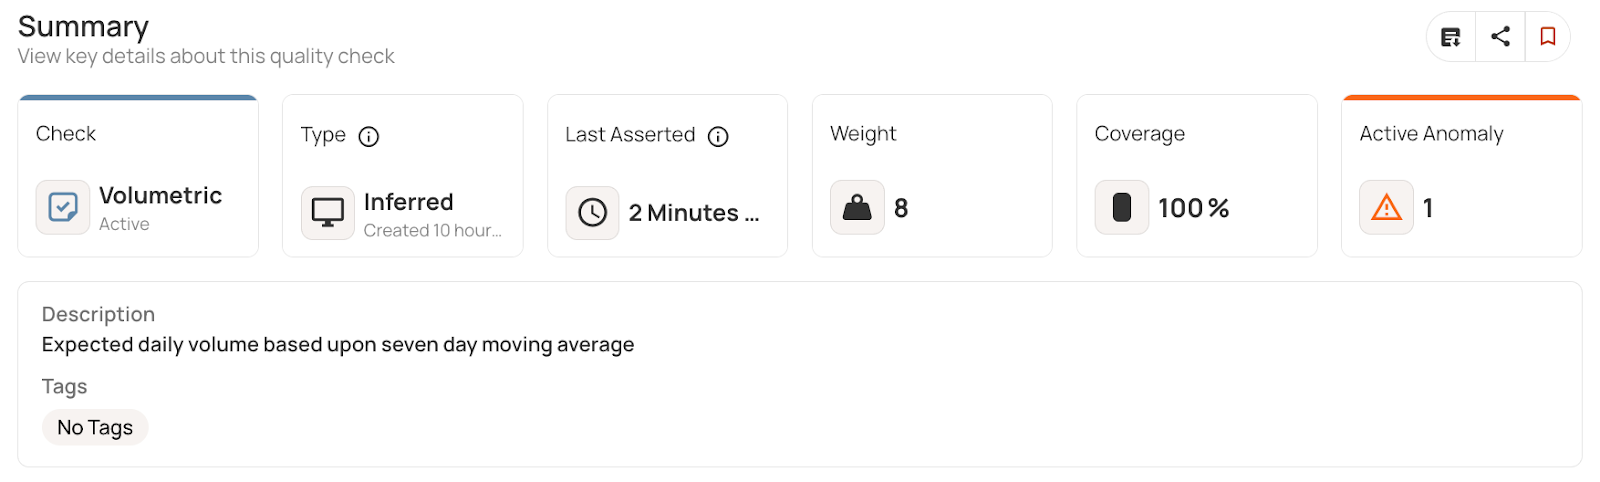
Simple percentage-based models treat all checks equally, while binary approaches only track whether fields have any validation. Exponential scoring rewards breadth over depth: The first check provides substantial value (~60), with diminishing returns for additional checks (~84 for two, ~94 for three). This encourages monitoring all critical fields rather than over-validating a few. Qualytics implements this scoring model to balance coverage across datasets. At the table level, coverage identifies business-critical fields that lack adequate monitoring. The system aggregates these scores to identify critical business fields lacking sufficient validation.
As shown below, quality analysis for the Orders table shows low coverage, and the system recommends implementing additional checks to validate data patterns and business rules.
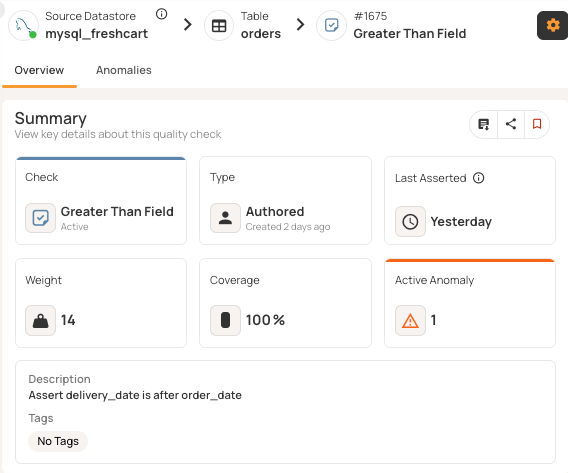
For example, FreshCart's Orders table contains delivery_date and order_date fields that require logical validation. Without coverage, temporal logic violations go undetected. Order 5001 shows delivery occurring before the order was placed.
Adding a check (delivery_date > order_date) increases both coverage percentage and the overall quality score by validating previously unmonitored field relationships.
{{banner-small-1="/banners"}}
Last thoughts
The eight dimensions covered in this article represent a comprehensive approach to data quality assessment. From validating individual field values to monitoring entire dataset patterns, these dimensions address every layer where data issues can emerge. Understanding these dimensions gives you clear criteria for diagnosing data quality problems, but putting them into practice requires tools that work well with your current data systems and can automate checks at scale.
Platforms like Qualytics offer ready-made connectors for databases, warehouses, and streaming data. They automatically infer validation rules from historical data patterns, provide interfaces for business and engineering teams to work together, send smart alerts via Slack, Teams, or PagerDuty, and offer API access for continuous delivery. With these features, data quality becomes proactive and automated, building a strong base for reliable analytics and AI. This allows you to go beyond just tracking eight scores on a scoreboard and makes data quality a proactive and integrated part of your workflow, so you can catch problems before they corrupt your reports, break your pipelines, or undermine the machine learning models that depend on your data.
Chapters
Improving Data Governance and Quality: Better Analytics and Decision-Making
Learn about the relationship between data governance and quality, including key concepts, implementation examples, and best practices for improving data integrity and decision-making.
Data Quality Checks: Tutorial & Automation Best Practices
Learn the fundamentals of data quality checks, like structural and logical validation, monitoring data volume, and anomaly detection, using practical examples.
Data Quality Assessment: Tutorial & Implementation Best Practices
Learn systematic approaches to assess data quality using automated tools and best practices for reliable validation.
Data Quality Dimensions: A Complete Guide with Examples
Learn the eight data quality dimensions every data engineer needs to ensure reliable, accurate data pipelines.
Data Quality Scorecard: Dimensions, Granularity, and Best Practices
Learn how a data quality scorecard helps you measure, track, and improve your organization's data quality.
What to Look for in Data Quality Software: A Guide to Features
Learn which data quality software features help teams build and sustain scalable, automated quality programs.
From Reactive to Reliable: A Guide to Modern Data Quality Frameworks
Learn the six core components of a data quality framework and how they work together to ensure reliable data.
Data Quality Automation: How Modern Platforms Validate at Scale
Learn how automated data quality platforms infer validation rules, detect anomalies, and support remediation at scale.
Data Validation Software: 10 Must-Have Features to Look For
Learn how to evaluate data validation software using 10 must-have features for scalable, automated data quality.
The Data Quality Maturity Model: A Six-level Model for AI Readiness
Learn the six-level data quality maturity model that maps your organization's path from ad hoc fixes to proactive AI-augmented governance.
Data Quality Metrics Examples: The Complete Guide
Learn how to turn abstract data quality dimensions into computable, actionable metrics that catch pipeline failures and data errors before they become incidents.
How to Choose the Best Data Quality Tools for Your Team: Key Features and Benefits
Learn what modern data quality tools do, why they matter, and how they use AI and automation to keep your data trustworthy.