Three enterprise teams used AI-augmented data quality findings to build durable governance controls. Here's how they did it.

May 21, 2026
5
min read
Table of Contents

Most data quality platforms can find problems. The harder question for governance teams is what happens next. Who investigates? Who owns the escalation? Does the finding become a durable control, or a one-time fix nobody maintains?
Augmented data quality changes the answer to that question. In the augmented model,
- AI handles what doesn't scale manually: scanning millions of records, running cross-system analysis, executing daily checks against production data
- The Human Practitioners do the work that requires expertise: interpreting findings, calculating business impact, defining what "good" looks like, making the governance call
Both contributions are necessary, and neither works alone!
We see this pattern across enterprise deployments in industries like manufacturing, insurance, and financial services. In every case, the pattern is the same: a detection event starts the process, but a governance outcome finishes it. The three examples below walk through that pattern in detail, with specifics anonymized and workflows intact.
Catching the anomaly no one was looking for
Industry: Global manufacturer
Use case: Bill of materials cost roll-up integrity
A tech lead managing a data quality program was working with millions of bill-of-materials (BOM) and standard-cost records spanning hundreds of finished-goods product families. He suspected drift in the cost roll-ups, but couldn't prove it across the full hierarchy without scanning every record. No single rule would catch it. No manual sample would be large enough. And nothing in the pipeline looked broken: records arrived on time, in the right schema, at the expected volume.
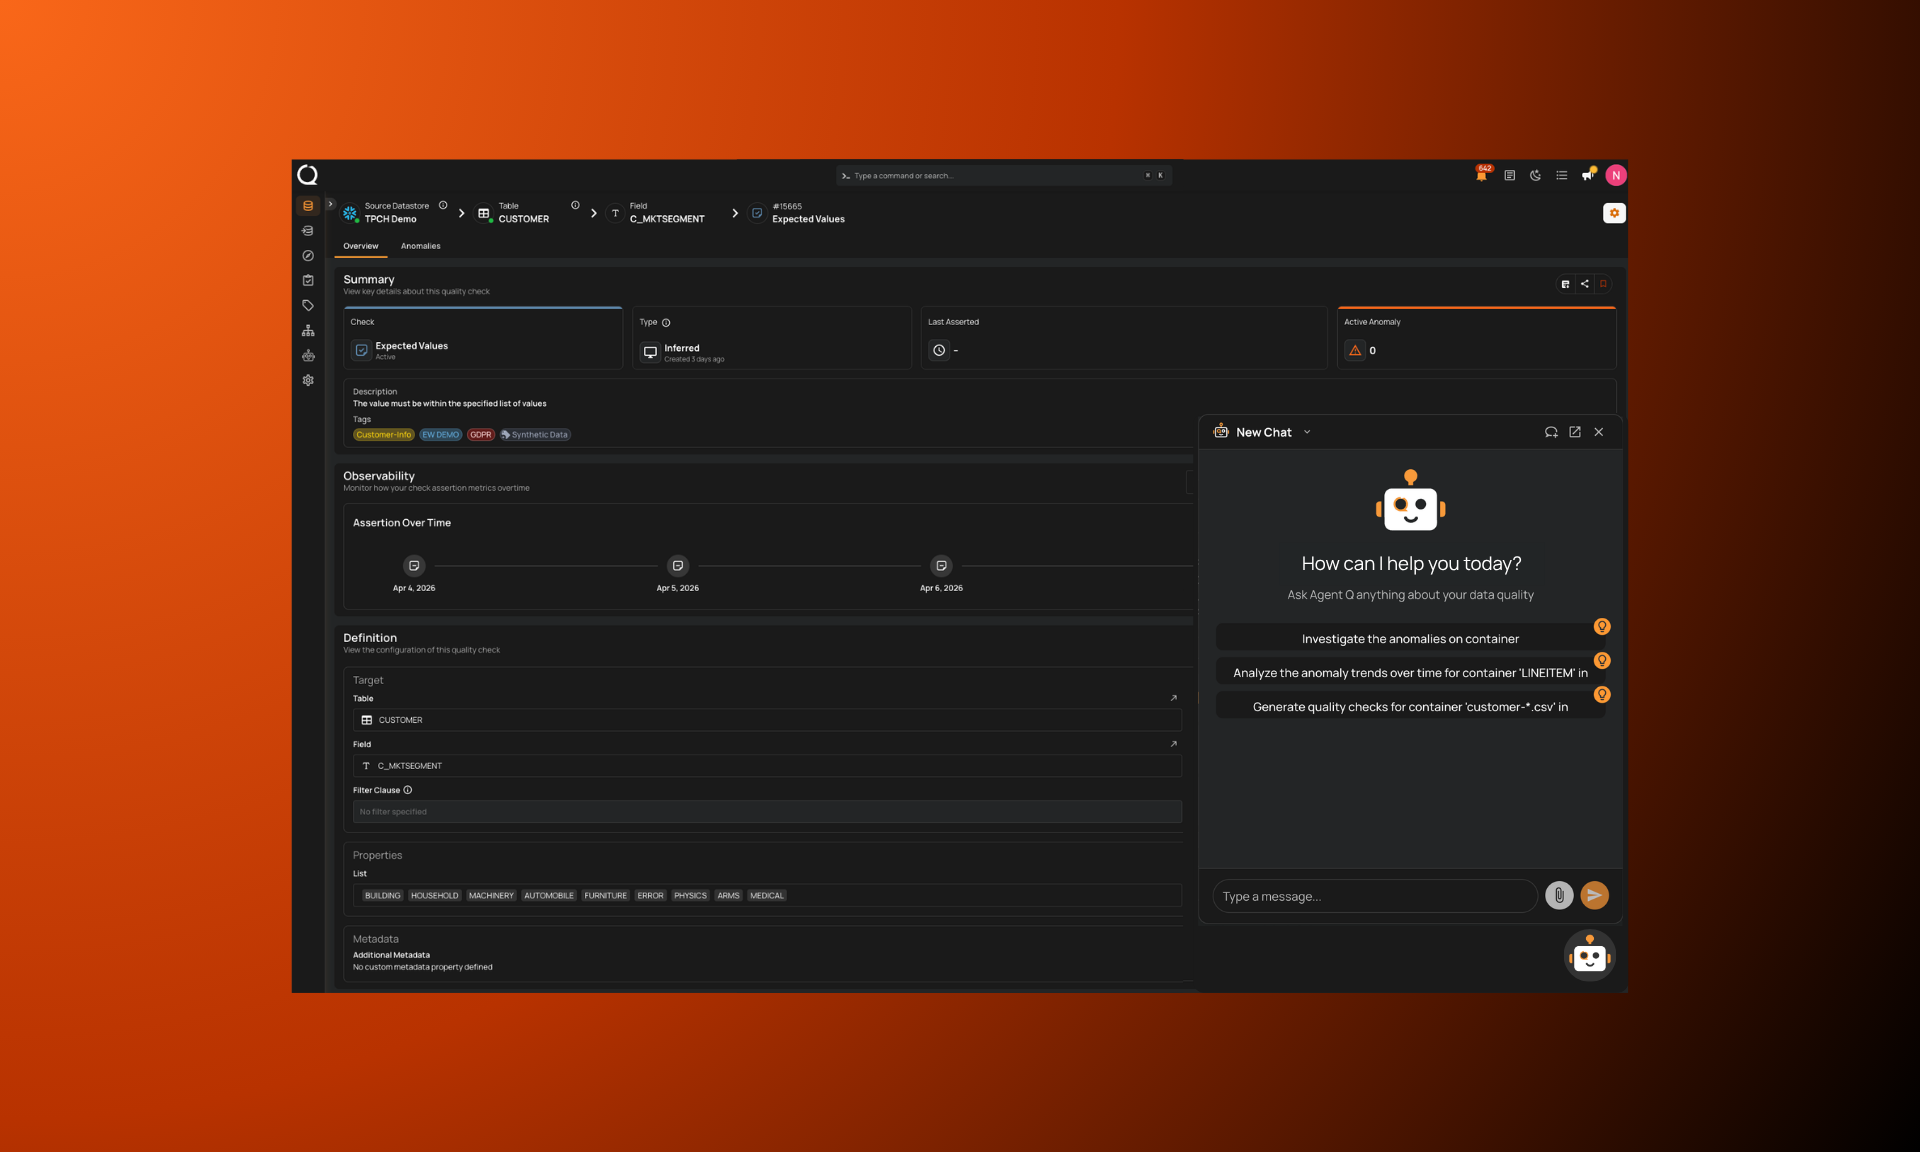
He worked with Qualytics' AI agent, AgentQ, to build the check. AgentQ scanned the full product master and quantified a 12% inconsistency in component cost roll-ups. That's a scale that manual sampling and static rules would never have caught. Observability tools would have missed it too, because every pipeline health metric looked fine.
The tech lead investigated. He understood that standard-cost roll-ups flow directly into COGS (cost of goods sold), inventory valuation on the balance sheet, margin reporting, and the audit trail behind every quarterly close. He pulled the dollar-impact calculation himself and validated that the inconsistency was real, not a data artifact or a known exception.
That same week, the finding went to three executives, each with a different reason to care: the Vice President of Manufacturing, whose plants and standard costs were directly affected; the Chief Financial Officer, who owned the downstream COGS and balance-sheet impact; and the Chief Information Officer, who was accountable for data integrity across the systems that produced the records.
AgentQ didn't stop at detection. It helped the tech lead build the automated check that catches BOM cost roll-up drift going forward. What had been a quarterly manual exercise became a continuous, scheduled control. Discovery happened once. Automation made it durable.
The tech lead turned a one-time finding into a permanent control. That work required his domain knowledge of cost accounting, his judgment about materiality, and his relationships with the leaders who needed to act. The platform gave him the visibility he couldn't surface manually. He turned it into a governance outcome.
Filtering 40,000 records down to the ones that matter
Industry: National insurer
Use case: Underwriting review prioritization
A director of data governance needed to identify which active homeowner policies required manual underwriter review. There were roughly 40,000 in production. The underwriting team couldn't review all of them, but skipping the full volume risked missing the ones that genuinely needed a closer look.
Without a way to filter precisely, the team faced a binary choice: review everything (too expensive) or review a sample (too risky). Neither option was good enough.
Qualytics ran the underwriting rule logic across both the policy center and claims center systems, integrating analysis across both. Of 40,000 policies, 586 were flagged for manual review.
The director and the underwriting subject matter expert had defined those rules in the first place. The logic encoded their knowledge of risk indicators, regulatory requirements, and policy structure. Once the platform returned results, the director spot-checked six or seven of the 586 in production and confirmed each was correctly identified. Each flagged policy then went to a human underwriter who made the final call.
The platform did the volume filtering. The underwriter's expertise got applied where it mattered most: on the 586 records that actually warranted judgment, instead of being diluted across 40,000 records where most were clean. Detection scaled so human judgment could stay focused.
Building a check that learns from your decisions
Industry: Insurance
Use case: Policy-number change detection for financial reserves
A data governance program manager needed to detect when a policy number changed on a claim record so the finance team could correct reserves before month-end. The problem is specific but the financial consequences are significant: when a policy number changes mid-cycle, the reserves system never receives the offset/onset transaction. Reserves end up on the wrong line of business, and the error isn't caught until reconciliation, sometimes weeks later.
A daily data diff scan runs against the policy table and flags policy-number changes within 24 hours. The check is automated, scheduled, and continuous.
The program manager defined the business rule. She chose daily snapshots over monthly based on her understanding of the reserves cycle and the window of exposure. When the daily scans initially surfaced too much noise, she iterated with the team to add a filter that restricts the diff to changed records only, excluding added or removed records that were creating false positives. Every refinement encoded more of her domain knowledge into the check.
When the first real policy number change was detected, it was caught within 24 hours and corrected before it reached the financial system.
This refinement loop is what makes augmented data quality distinct from both manual rule writing and fully autonomous AI. The platform ran the check at scale and on schedule. The program manager defined what "correct" looked like. When the initial configuration produced too much noise, she tuned it. The system got more precise as a result, and each adjustment made the check more valuable over time.
The pattern across all three
Across all three examples, the platform handled the part that doesn't scale manually and a practitioner did the part that requires expertise: interpreting the finding, calculating impact, defining what "good" looks like, making the governance call.
The tech lead who caught the BOM cost roll-up drift didn't need AgentQ to tell him what standard costs flow into. He suspected the drift existed, he needed AgentQ to scan millions of records and quantify the 12% inconsistency he couldn't validate manually.
The underwriting director didn't need the platform to explain risk indicators. She needed it to filter 40,000 policies down to the 586 that warranted human review.
The program manager didn't need the data diff to understand reserve accounting. She needed it to run daily, on schedule, against production data, and flag changes before they compounded.
In practice, augmented data quality means teams spend less time on detection and more time on interpretation, governance decisions, and cross-functional conversations that require their expertise.
Every example started with a detection event and ended with a governance outcome: a new automated check, a targeted review process, or a refined daily control. The interesting work in data quality starts after the flag. Augmented data quality creates the conditions for governance teams to do that work consistently.
Chapters
Related Articles
Qualytics Introduces the Data Control Layer for Trusted Context
AI systems depend on context, but context without control creates risk. Qualytics introduces the data control layer that enables trusted data at the moment it is used.

The Illusion of Data Quality: When Every System Is Green but Reporting Is Wrong
Vertical data quality keeps systems correct. Horizontal data quality ensures systems produce reporting enterprises can trust.
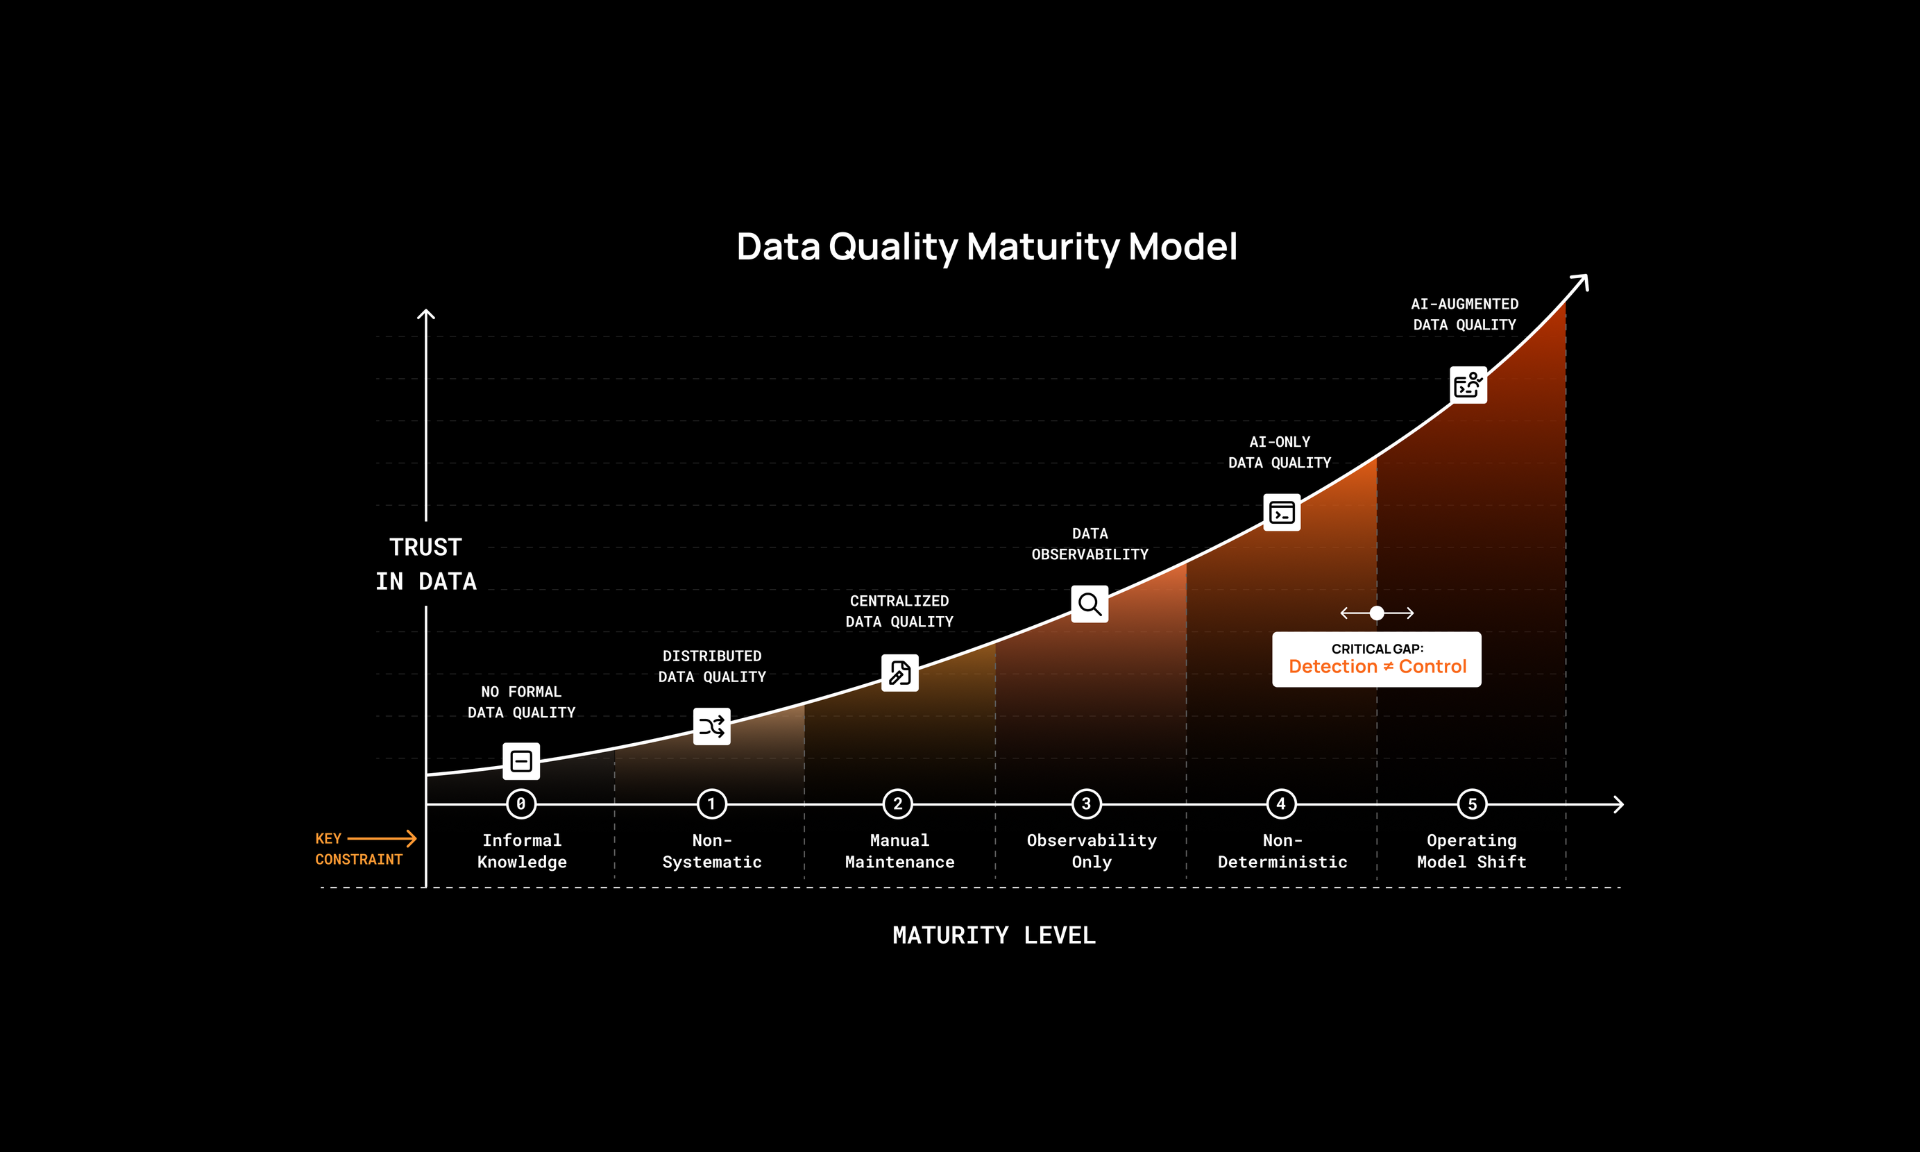
The Data Quality Maturity Model: Moving from Incident Response to Proactive Data Trust
A framework outlining how organizations evolve data quality into proactive, governed control across complex data environments.
Related News
Qualytics Introduces the Data Control Layer for Trusted Context
AI systems depend on context, but context without control creates risk. Qualytics introduces the data control layer that enables trusted data at the moment it is used.
The Illusion of Data Quality: When Every System Is Green but Reporting Is Wrong
Vertical data quality keeps systems correct. Horizontal data quality ensures systems produce reporting enterprises can trust.
The Data Quality Maturity Model: Moving from Incident Response to Proactive Data Trust
A framework outlining how organizations evolve data quality into proactive, governed control across complex data environments.