Learn how AI automates data quality rule generation, profiling, and monitoring to replace manual validation at scale.
Table of Contents
Like this article?
Follow our monthly digest to get more educational content like this.

AI for data quality is the use of machine learning to automatically profile data, infer validation rules, and adapt those rules as the data changes, replacing the manual work of writing and maintaining every check by hand. When working at scale, the main challenge is keeping quality high across hundreds of tables, each changing on its own schedule.
Handwritten rules can't keep up. You write a check, a schema shifts a few weeks later, and it either breaks loudly or worse as it keeps passing while the data underneath it quietly goes wrong. Do that across every table and you stop doing data quality and start doing rule maintenance full-time, usually firefighting whatever slipped through overnight.
This is where an inference engine takes over: It learns what your data normally looks like, drafts the bulk of your checks, and adjusts them automatically as things drift, leaving you to focus on the small set of genuinely hard business rules that still need human judgment. In practice, that can cover the bulk of the work, often up to 95%.
In this article we cover the practices that make AI-driven data quality work in production, from profiling and rule inference to continuous monitoring and AI/BI readiness. We focus on structured data in warehouses, lakes, and databases, not unstructured content or application-level checks.
Summary of AI for data quality best practices
Profile your data first
To spot when data is not correct, you first need to know what it looks like when it’s right. That sounds obvious, but it's the step most teams skip—they jump straight to writing checks based on what they assume the data contains, and the assumptions are usually a year out of date. Profiling reads across your fields and records the real picture: row counts, data types, nulls, value ranges, and how values are spread across each column.
Details matter because different field types can fail in different ways. For a categorical column, you need to know the distinct values and their cardinality, how long the strings are, and how often each value appears. For example, a status column that has quietly held four values for two years and suddenly shows nine is telling you something, usually that an upstream system started emitting codes nobody warned you about. For numeric columns, you want to see the minimum and maximum, the average and median, and the percentiles that show a normal range. These numbers are the basis for every rule that comes next. An inference engine can’t suggest that a column is never negative on schema alone; profiling has to show what values have actually been there.
A single profile gives you a snapshot. Profiling on a schedule gives you a moving picture of how each dataset drifts, which is what you need once tables change weekly and nobody remembers what normal looked like last quarter. Most platforms let you tune profiling depth to trade cost against detail, so you can profile a billion-row fact table less aggressively than a small dimension table that feeds reports people actually read.

Automate rule generation, but apply human judgment
Writing rules by hand means each new table takes more engineering time, especially as the number of columns grows. With rule inference, the engine reads the profile and suggests checks, so adding new tables doesn’t increase your workload as much.
It helps to think of inferred rules in layers of increasing complexity, though how many layers a platform automates varies:
- Type and null constraints: For example, a value in a column must be an integer, or one must never be empty.
- Range validation: Values fall between bounds, e.g., dates don't land in the future.
- Pattern conformity: Emails, phone numbers, and IDs match the format the data has always used.
- Cross-field validation: A ship date never precedes an order date.
- Complex business rules: Logic specific to your domain that no engine can guess.
Automation handles the first four levels well; the fifth is where you come in. A good platform should let you easily create the last 5% of rules, and often provides templates for common but complex rule types. This way, you just fill in the details instead of writing new logic from the ground up.
Don't push inferred rules straight into production—do a dry run first, executing the proposed checks against real data and showing you what would have flagged (without raising a single alert or touching a downstream system). Skip this step and you may find out the hard way when an over-eager inferred rule starts paging the on-call engineer about “anomalies” that are just how the data has always behaved, and the team learns to ignore the alerts within a week. Skim the results, kill the checks that misread your data, keep the rest, and only then promote them. That review is the human judgment the heading asks for.

{{banner-large-1="/banners"}}
Check volumetrics and freshness before full integrity scans
The simplest checks can tell you if it’s worth running the more expensive ones. Divide your checks into two types:
- Metadata checks only look at things like row counts or last-modified times, without reading the actual data.
- Data integrity checks read every value and use more computing power.
In Qualytics, these run as two separate operations, rather than one triggering the other. You run integrity scans on a schedule set by business needs and run the cheap metadata checks far more often. When a metadata check shows today's load never landed or arrived half-empty, that's your signal to fix the incoming problem before scanning. The rows that did land might be perfectly valid, but scanning a partial or stale dataset just burns compute on results you'll have to throw out once the rest arrives.
Two checks catch most failures:
- A volumetric check makes sure the row count is what you expect. For example, if a table usually adds hundreds of thousands of rows daily but suddenly adds none, an upstream job has failed, usually hours before anyone downstream notices the dashboard looks thin.
- A freshness check confirms that data arrived on time, so if a load expected every day is late, it shows up as an anomaly. These checks don’t need to load any rows, which makes them cheap enough to run on every table every day.
The threshold is the part that doesn't scale, and that's where AI earns its place. “Expect 100,000 rows a day” is fine for one table, but you have hundreds, each with its own rhythm, and those rhythms drift. Nobody has time to re-tune a number per table every month, so in practice the thresholds go stale and the alerts get muted. Instead, the platform learns each table's historical volume and cadence, infers the expected range, and flags what falls outside the learned pattern.
Used like this, metadata checks act as an early warning system. They run all the time and surface a broken load early, so you can fix the source before your next scheduled scan reads it, and you're not spending compute scanning a dataset that isn't complete yet. This way, you focus your efforts where they matter most.
Treat human feedback as a training signal
This is where automation and human judgment meet, and it's the part most teams under-use. The platform generates rules automatically, but your experts review them and make sure they fit the business, and take responsibility for the results. You can turn off a rule before it runs if it’s not relevant, or after a scan, mark a flagged anomaly as invalid if it’s a false positive.
The trap is treating those dismissals as throwaway clicks. Mark a false positive, close the tab, and a tool that doesn't learn flags the same harmless pattern next week, and the week after, until the team stops reading the alerts at all. A platform that learns from your choices does the opposite: mark the same kind of anomaly invalid a few times and it downgrades the check behind them, and eventually disables it. Instead of re-litigating the same end-of-quarter spike every three months, an expert marks it expected once, the system stops flagging it, and it records who made that call and why. Your judgment becomes a reusable rule instead of a recurring chore.
Make quality checks queryable, and wire them into your pipelines
A finding that only lives in a vendor's dashboard is one that someone has to remember to go look at. That usually happens Monday morning or right after something broke, and not at 2 am when the bad load landed. If your pipelines, BI tools, and AI agents can't query it, nothing acts on quality except a human who happens to be looking.
Store your results in a place you control, such as a dedicated enrichment datastore in your own warehouse, instead of relying on the vendor’s UI. The dashboard is the easy default, which is why most teams stop there and only feel the cost later—when they need to join quality data to something and can't.
Once your findings are in a table you own, you can analyze, join, and report on them as regular data. For example, you can use SQL to track anomaly trends by domain and severity.
SELECT data_domain,
       severity,
       DATE_TRUNC('week', detected_at) AS week,
       COUNT(*) AS anomalies
FROM quality_findings
WHERE detected_at >= CURRENT_DATE - INTERVAL '90 days'
GROUP BY data_domain, severity, week
ORDER BY week DESC, anomalies DESC;
The same query ability turns data quality into a gate, not just a review step. If a query can read a dataset’s score, so can a pipeline: It reads that score before promoting data and stops the promotion if the score has fallen below the threshold you set. Skip the gate and the anomaly still fires, just after the bad numbers are already in someone's report.
Gating this way means the platform’s features must be accessible without using the UI. Look for three access options: a REST API, a CLI, and an MCP server so that AI agents can run quality checks directly. Before choosing a tool, ask if you can do everything from code or if some tasks still require the interface.
For example, here's the gate as a CI/CD step; this one is a shell script, but the same three calls work from any CI/CD tool or language. You can run a scan with the Qualytics CLI, read the datastore's latest quality score from the API, and fail the build if it dropped below the threshold.
set -euo pipefail

DATASTORE_ID=1
THRESHOLD=95

# Trigger a scan and wait for it to finish
qualytics operations run sync --datastore-id "$DATASTORE_ID"

# Read the most recent daily quality score (0-100) for the datastore
SCORE=$(curl -s \
  -H "Authorization: Bearer $QUALYTICS_TOKEN" \
  "$QUALYTICS_URL/api/datastores/$DATASTORE_ID/quality-scores" \
  | jq '.[0].total')

# Fail the pipeline if quality regressed
if (( $(echo "$SCORE < $THRESHOLD" | bc -l) )); then
  echo "Quality score $SCORE below threshold $THRESHOLD, blocking promotion."
  exit 1
fi
echo "Quality score $SCORE, promoting."
Since these checks are part of your pipeline code, your rules are versioned with your schema. This means that a schema change and the checks that protect it are included in the same pull request and reviewed together.
This access also lets AI agents use your quality data, not just your pipelines. With an MCP server, an assistant can ask questions in plain language, like which datastores dropped below a score of 95 this week, or draft a check and see what it would flag—all while the platform’s API handles the details. This becomes more important as pipelines start letting models make decisions, since an autonomous agent can check data quality before acting on it.
Assign ownership at the check level, not the dataset level
Assigning quality ownership at the datastore level is the tempting default, but it is too broad. One table might have a column managed by finance, another by fulfillment, and another that no one uses. If you treat all three as one person’s responsibility, every anomaly goes to the same inbox, and usually someone who doesn't understand half the rules is firing at them. They mute the channel within a week, and now nobody's watching any of it.
Assign responsibility at the level of each check. Use tags to label each check with the team that owns it, and any anomalies inherit those tags. This way, two checks in the same table can go to different teams, and the weight you give each tag (higher for critical data, lower or negative for noise) helps sort the most important issues to the top. While this is a convention, not a rule engine, it ensures that finance and fulfillment checks don’t end up in the same alert stream.
Pinning an anomaly to a person happens at the anomaly itself. The detail view carries an assignee field, a dropdown of users, so once something fires you hand the fix to whoever should own it. Skip this, then you have an anomaly that belongs to a team but no one in particular and everyone assumes someone else has it, and it sits Active for a week.
Tags decide which team an anomaly belongs to; the assignee decides who closes it. Detection is only half the job, so route anomalies into your ticketing system, where remediation is tracked.
Qualytics can open a ticket from an anomaly and stamp the anomaly reference onto it, and the ticket system owns the SLA and escalation rules. It tracks the history of the anomaly, which includes all status changes, the actor and timestamp, from Active to Acknowledged to Resolved or Invalid. Comments are a running log of stewardship.

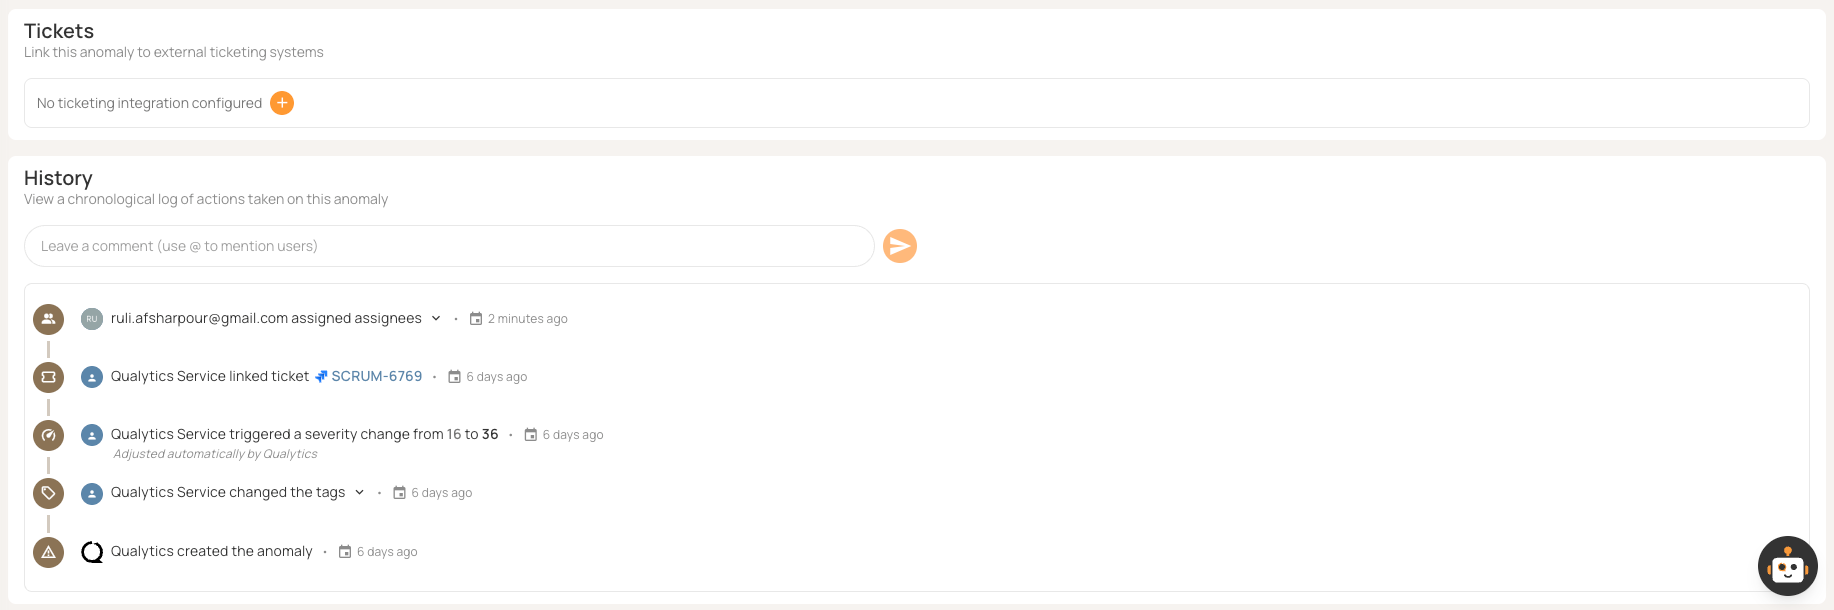
Qualytics anomaly detail view: severity, state (Active/Acknowledged/Resolved/Invalid), assignees, triggered check, inherited tags, comments, and sample failing records.
Use adaptive baselines instead of static thresholds
A static threshold is just a guess made at one point in time. Think about your order volume: Most of the year, it stays within a narrow range, but during Black Friday, for example, it jumps much higher before dropping again in January. A fixed threshold loses either way. Set it tight and it screams through your best sales week. Set it loose enough to survive Black Friday and it sleeps through a real 30% collapse in March, which is the failure that actually costs you, because no alert ever fires. Either way, you're left sorting through alerts that only reflect the calendar.
An adaptive baseline learns from your data history and moves the expected range as things change, though it needs enough history to settle before its ranges are dependable. Instead of setting a number, Qualytics reads the table's past volumes so it widens for Black Friday and tightens again in January without anyone touching it. A “Predicted By” check makes sure each value falls within a predicted range that you can adjust with a tolerance band. If a value fits the trend, it stays quiet; if it doesn’t, it gets flagged, even if the number looks normal.

Detect shape anomalies, not just rule violations
Most checks look at one value at a time: Is this salary below 40,000? Is this field empty? Does this row break a rule? Qualytics calls these record anomalies, and they catch problems you knew to look for. The harder failures hide in the structure, where each row seems fine on its own but the overall shape of data has changed underneath you.
Qualytics calls these shape anomalies because they are about changes in structure, not just incorrect values. It happens more often than you'd think: an upstream team renames total_amount column to amount_total, or an ETL job changes the columns it selects, and suddenly the column your report sums on is missing or empty. Every remaining row might still validate and every column-level check might stay green, with the dashboard looking healthy right up until that sum lands in a board deck as zero revenue because the column it pointed at is gone. A green check on a broken report is worse than a red one. Another example is when a date format changes across many records, e.g. order_date no longer follows the YYYY-MM-DD pattern your jobs expect.
You need both. Record anomalies catch the issues you planned for; shape anomalies catch what you didn’t, and a wall of green record checks gives you false confidence precisely because it's answering a narrower question than the one you care about.
Keep raw data in your own environment
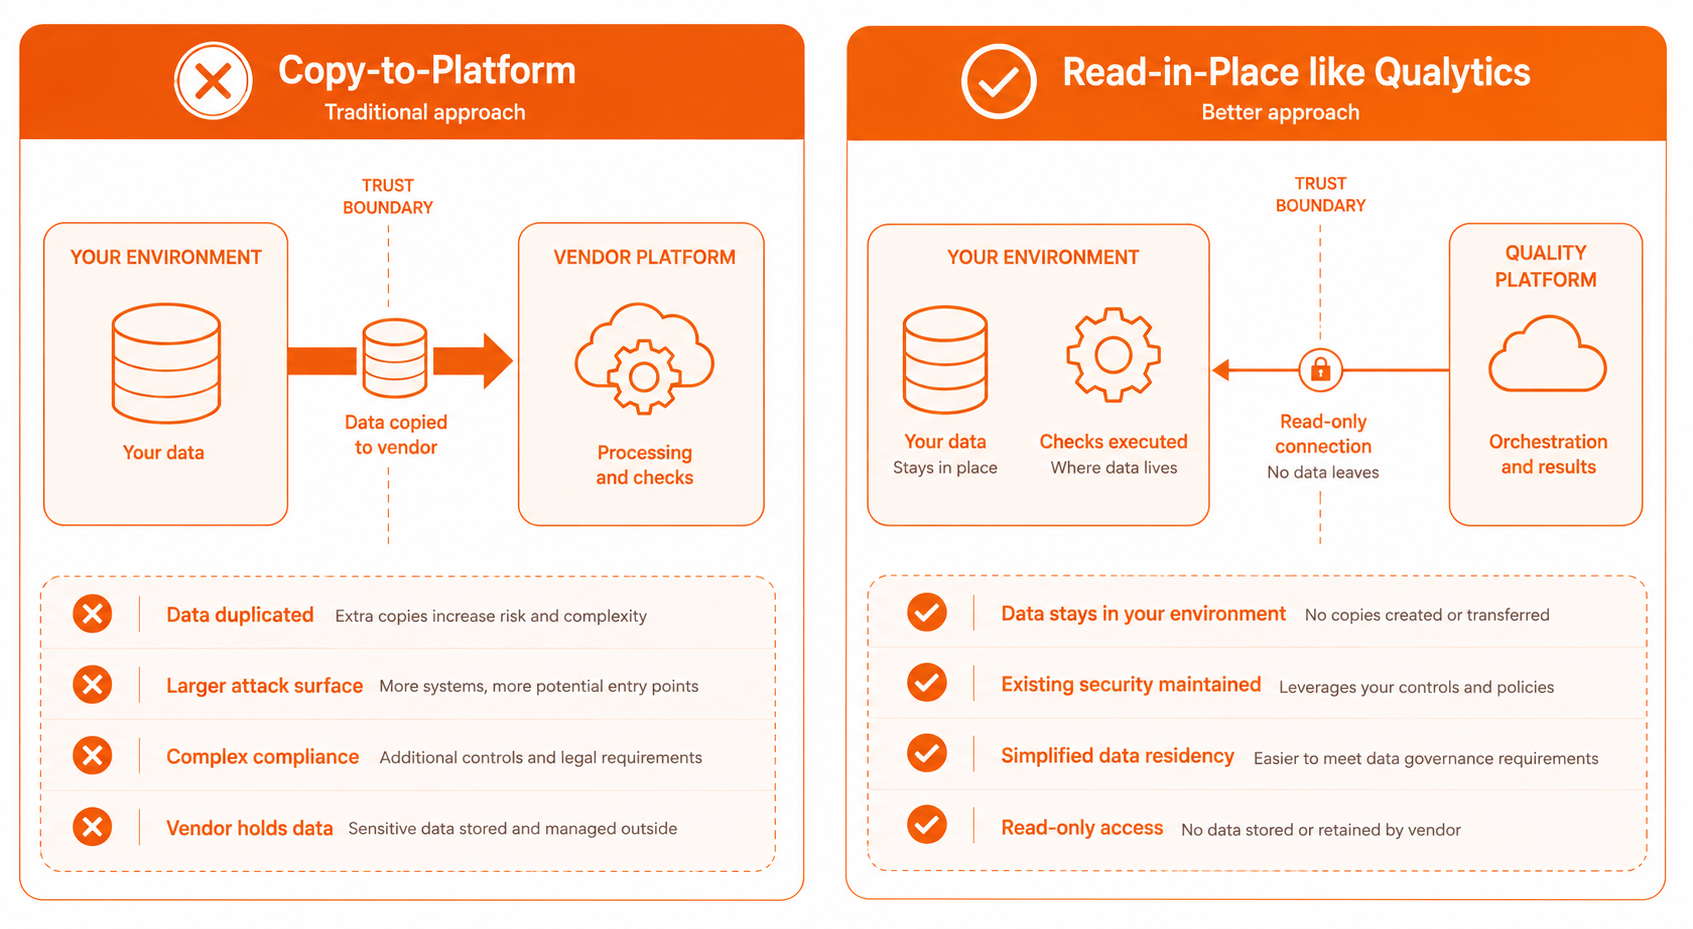
How a platform accesses your data is a security decision, even though it usually gets made as a convenience one. Some tools copy your data into the vendor’s environment to run checks because that's the easiest architecture for them to build and sell. This means you have a second copy to secure, manage, and keep updated. If your data is subject to residency rules, moving it across boundaries can turn a technical choice into a legal problem.
Reading data in place avoids all of these issues. Validation runs through a read-only connection, so your raw data never leaves your control. When evaluating a tool, make sure it connects with a read-only service account and can’t make changes to your data. A quality platform should never need to write to the data it checks.
{{banner-small-1="/banners"}}
Conclusion
The thread running through all of what is discussed above is a shift from reacting to data problems to anticipating them first. Profiling gives AI the information it needs to learn from and inference creates most of your checks while you still make the final calls on complex cases. Running cheap metadata checks focuses your resources where they actually matter and using your feedback as a training signal helps the system improve over time.
None of this takes the expert out of the loop. AI handles the bulk of detection, but the business-specific calls still come down to human judgment. The rest is about making data quality something your systems can act on and not just observe. Queryable findings will let you use quality as a CI/CD gate. Check-level tags and assigning anomalies to the right people ensure each issue goes to the right place. Adaptive baselines and shape anomalies catch both expected and unexpected problems. Validating in place keeps everything within your security boundaries. Together, these steps turn data quality from a list of broken rules into a foundation your analytics and AI can rely on.
Chapters
AI for Data Quality: A Practical Guide to Automated Monitoring at Scale
Learn how AI automates data quality rule generation, profiling, and monitoring to replace manual validation at scale.
AI-Powered Data Governance Best Practices: Automate, Govern, and Stay Accountable
Learn how AI transforms data governance from a manual burden into a scalable, intelligent, automated system.