Mid-March 2024 platform update introducing new features, performance improvements, bug fixes, and enhancements to data quality monitoring capabilities and user experience.

Mar 21, 2024
3
min read
Table of Contents

Feature Enhancements
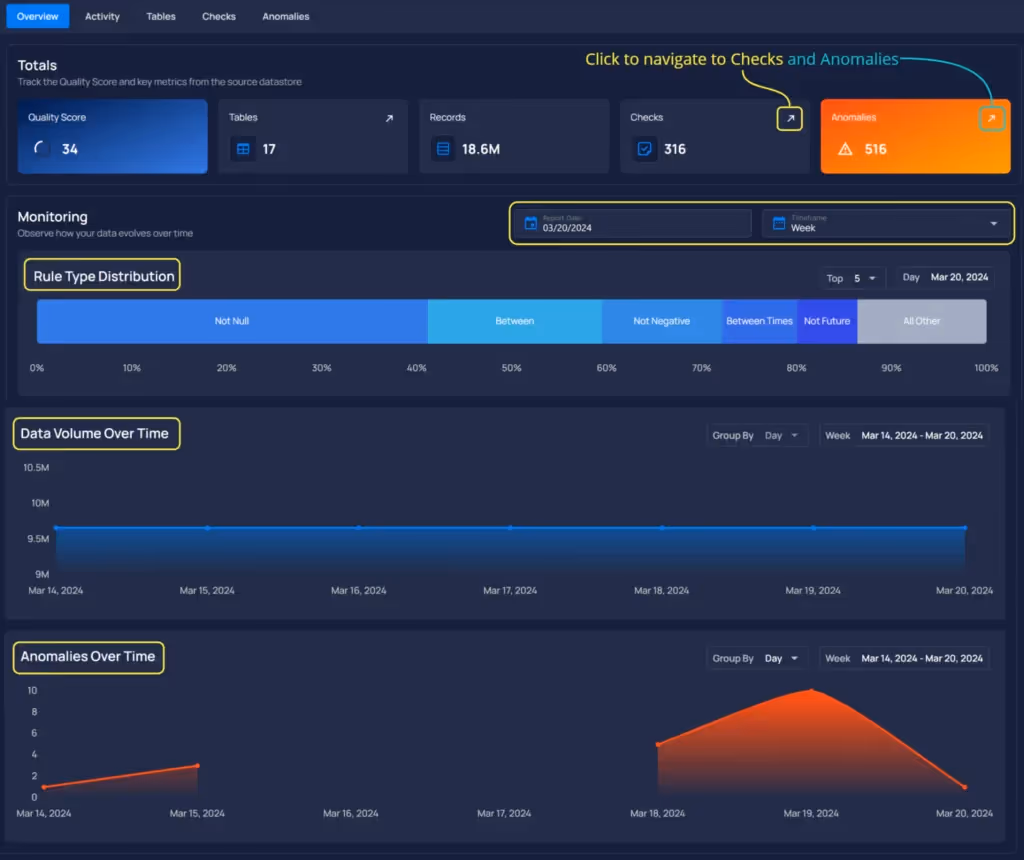
NEW: Overview Tab
We have added significant UI enhancements at the datastore and container levels, including:
- Navigable check and anomaly counts
- Page-specific histograms for Rule Types
- Out-of-the-box Data Volume and Anomaly time-series visualizations
- We also now display all files that are included in a file pattern on demand:
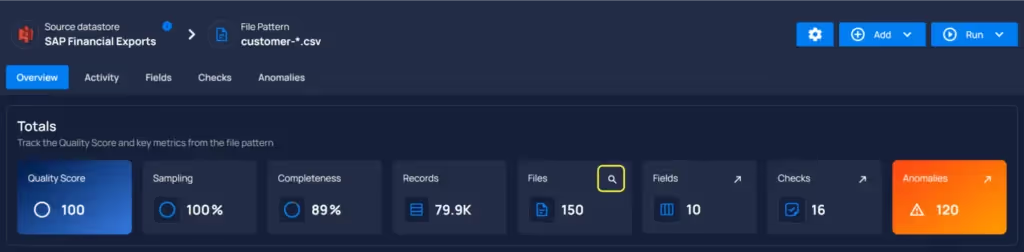
- Field Listing Enhancements:
- Fields displayed as search results now display characteristics like quality score, completeness, and histograms.
- Clicking on a field now displays field details as a popup modal rather than redirecting the user to the field page, allowing for quick navigation among fields without leaving the search results page.

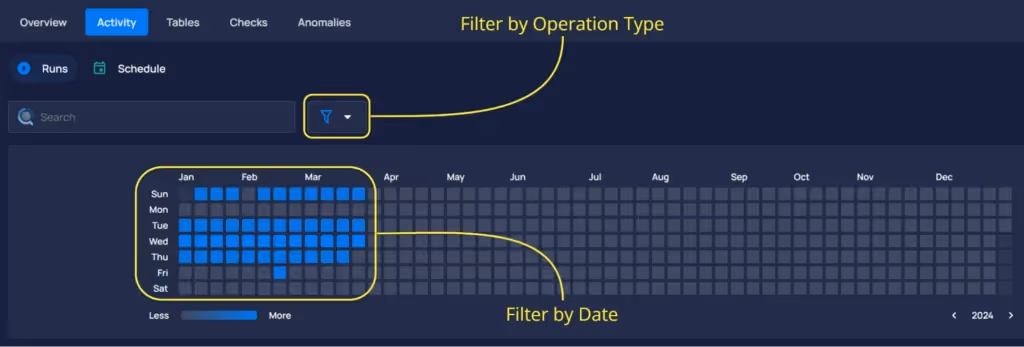
Heatmap Overhaul:
- Previously, the heat map on the Activity tab only showed data associated to Scans. We now display information based on all operation types.
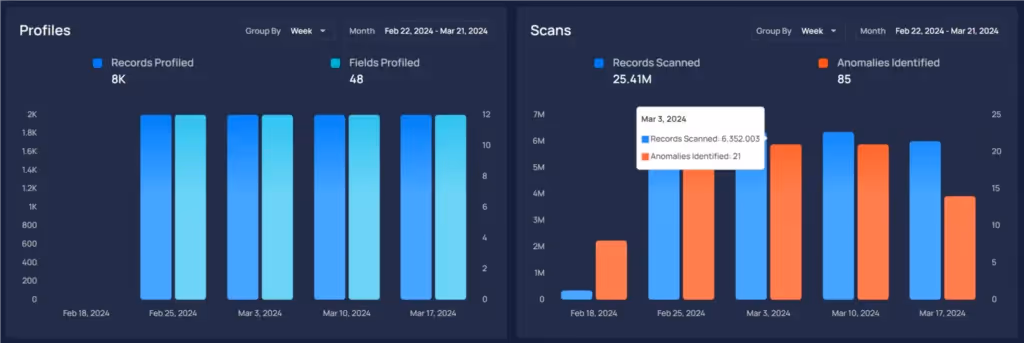
- Explore Page Update:
- The Explore dashboard has been reworked to consolidate correlated data quality metrics. Record and field profile counts are now displayed together, as are records scanned and the count of anomalies that those scanned records produced.
- Datastore Metrics - Accuracy Improvement
- Previously, we displayed NULL and Zero values the same way. Since those two terms are not interchangeable, we have updated the UI to clearly indicate whether metadata metrics are truly zero or simply unavailable.
General Fixes
- UI Wording and Display for Cataloged vs Profiled Fields:
- Addressed user confusion surrounding the display and wording used to differentiate between fields that have been cataloged versus those that have been profiled.
- Updated the messaging within the tree view and other relevant UI components to accurately reflect the state of fields post-catalog operation.
- Implemented a clear distinction between non-profiled and profiled fields in the field count indicators.
- Conducted a thorough review of the CTAs and descriptive text surrounding the Catalog, Profile, and Scan operations to improve clarity and user understanding.
- General fixes and improvements
As usual, our User Guide and accompanying Change Log captures more details about this release.
Chapters
No items found.
Related Articles
Related News
Discover More From Qualytics.
Join the companies using Qualytics to make data quality proactive, automated, and shared across business and date teams.