September 14th update delivering enhanced metadata management, improved scan performance, expanded rule templates, and critical bug fixes for enterprise deployments.

Sep 14, 2023
3
min read
Table of Contents

Charts For Metric Checks
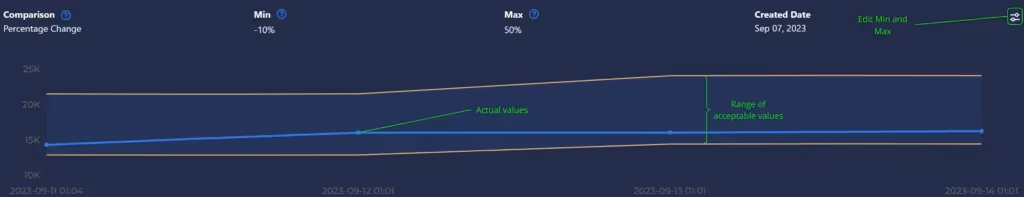
Metrics Checks allow users to monitor time series numeric values and to define expected minimums and maximums as percentage or absolute change. These are ideal controls for enforcing mission-critical SLA or KPI adherance and today’s release enhances this feature with interactive charting of the measurements over time. The new charts support easy visual confirmation of any violations and allow for in-line edits of the enforced expectations.
We look forward to your feedback!
Insights Dashboard Improvements
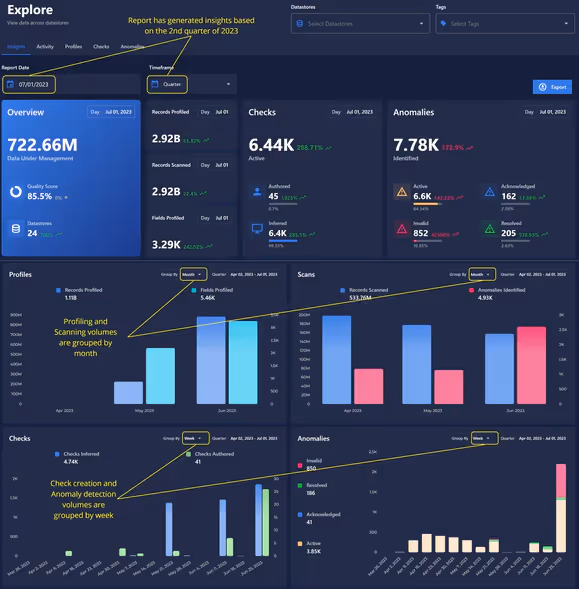
Performance has been significantly optimized for smoother interactions. Added more options for lookback periods via a Timeframe dropdown. In addition to the previously available weekly data, we now support the ability to generate reports based on the previous month, quarter, and year.
“As of” Report Date picker is now available, allowing users to generate historical data quality Insights with the end-date of their choosing. Once the appropriate lookback period and end-date have been selected, users now have additional timeframe options for grouping the resulting Profile, Scan, Check, and Anomaly volume visualizations.
As usual, our User Guide and accompanying Change Log captures more details about this release.
Chapters
Related Articles
Related News
Discover More From Qualytics.
Join the companies using Qualytics to make data quality proactive, automated, and shared across business and date teams.