Data lineage is live — plus now see what AgentQ is doing, dedicated operation pages, an audit tab, SAP HANA, and more
.jpg)
Jun 24, 2026
4
min read
Table of Contents

When something breaks in a downstream report, most teams spend hours tracing it back: they check the pipeline, query the warehouse, ping the data engineer. Meanwhile, the root cause of the problem has been sitting in a source system the whole time. This month, Qualytics gives you the map to truly get to that root cause. And for the first time, your copilots and agents can follow that same map, with controls already in place at every step.
Trace every signal to its source
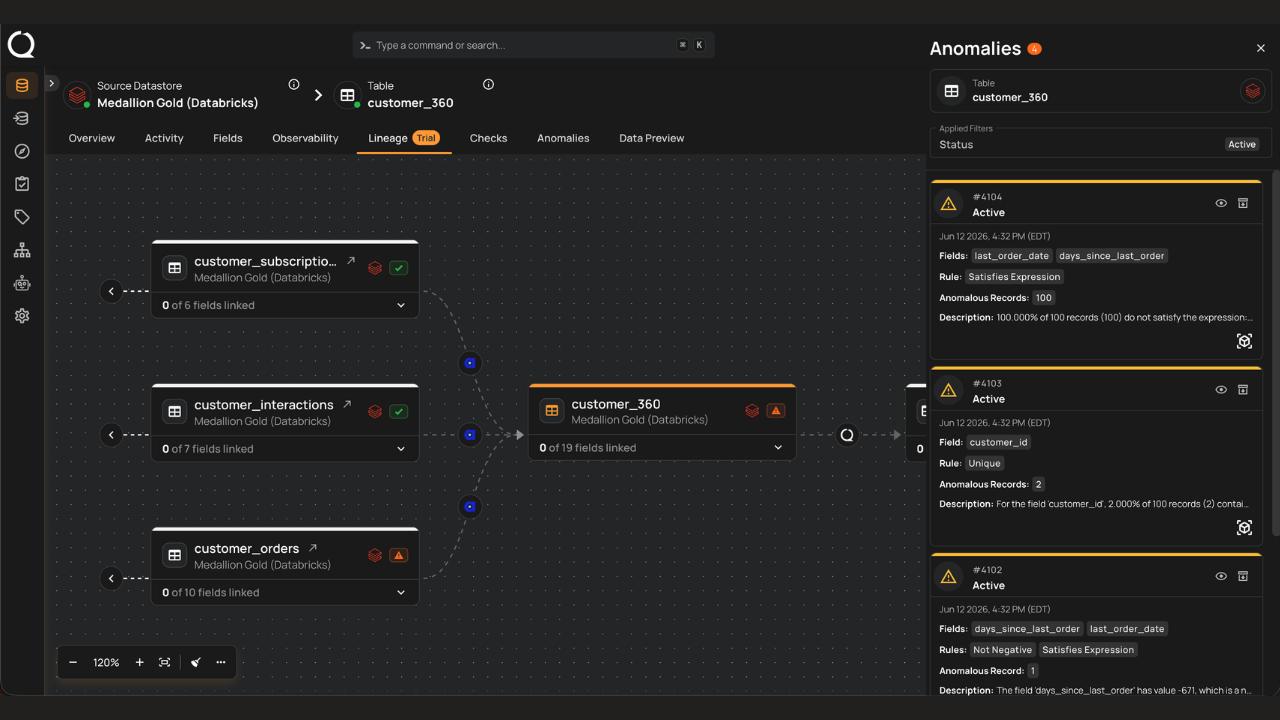
TL;DR Data lineage is now available in Qualytics, and it's free for all customers through at least Q3. You get a visual graph showing how data flows across your datastores, containers, and fields, with live anomaly counts woven directly into it.
Three workflows it enables
- Root cause investigation. When an anomaly fires on a reporting table, open lineage and walk the graph upstream. Every intermediate node shows its live anomaly badge, so you can see whether the problem is isolated or whether the same contamination exists at multiple stages. Click a badge and the side panel opens pre-filtered to that scope. You move from "something is wrong downstream" to "here is where it started" without leaving the quality context you're already working in.
- Impact analysis before changes. Before deprecating a column, renaming a table, or restructuring a pipeline, use the downstream view to see every container and field that would be affected. Relationships can be added or removed inline as part of that review, giving your governance team a documented record of what changed and why.
- Critical asset tracing. Trace any KPI, metric, or regulated field from its source across every container and computed asset where it appears, including across datastores. Whether you're tracking a number that feeds an executive dashboard, an input to an agent, or a PII field under BCBS 239, DORA, or SOX, you get a clear auditable path from source to consumption for every critical attribute in your environment.
Read the full blog to see how it works and what’s coming.
Lineage is available now, free for all customers through at least Q3. The tab is off by default and takes a few minutes to enable. Reach out to your Forward Deployment Engineer (FDE) to turn it on.
Know what AI is doing at every step
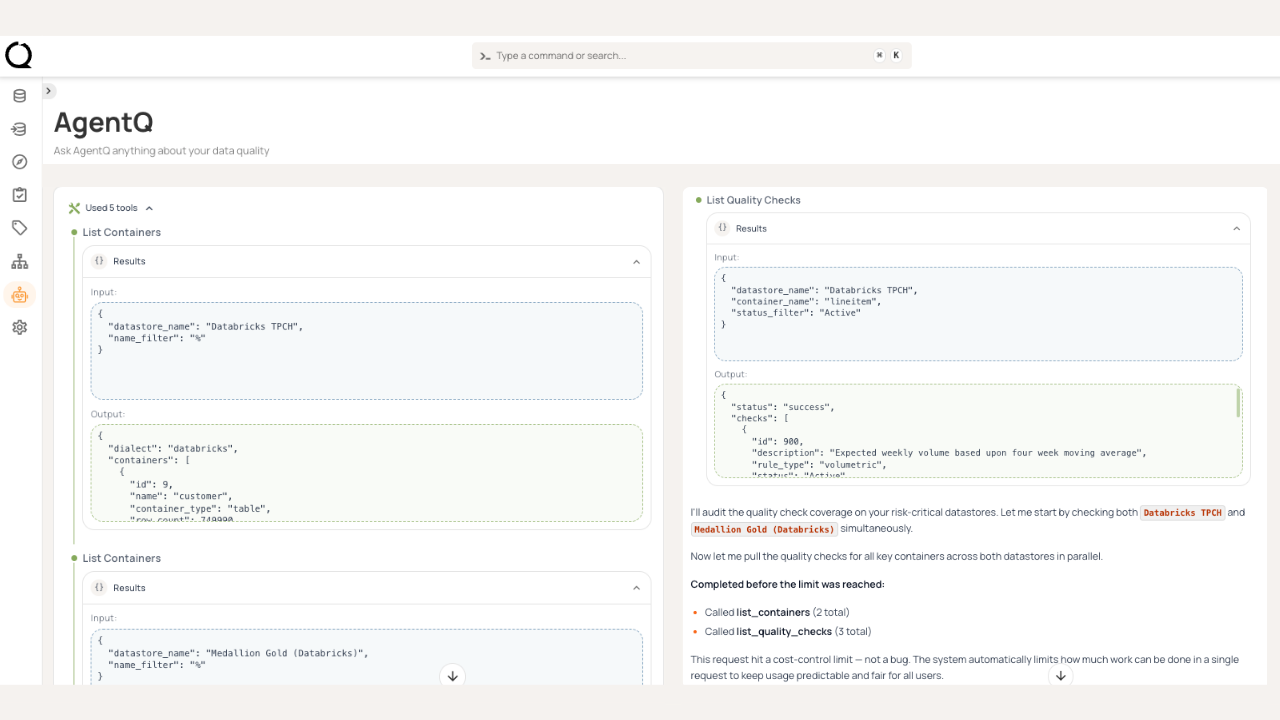
TL;DR AI shows up across Qualytics: in inferred checks, in AgentQ, in descriptions, in every recommendation. This month, it became a lot more transparent. You can see what AgentQ is doing in real time, every AI-generated asset is clearly labeled, and business-friendly descriptions are one click away on anything in the platform.
What changed
- Real-time visibility into AgentQ. When AgentQ works on a task, tool calls now render as a collapsible timeline with status indicators. Checks, computed assets, and operations the agent creates appear as clickable cards beneath the response. You can see exactly what actions it took, in what order, and inspect each result directly.
- AI labeled for what it does. Inference Threshold is now called AI Effort. Inferred checks are now AI Managed checks, with an AI badge so they're identifiable at a glance. Importance (for checks) and Severity (for anomalies) are now distinct concepts, which clarifies what the platform is telling you when something fires.
- On-demand description suggestions. Click the sparkle icon next to any description field to generate a business-friendly description of that asset, including computed tables, files, joins, and fields. Requires AgentQ.
The more transparent AI is, the more confidently teams can rely on it. These changes are about trust as much as usability.
Better visibility into all operations and every user action
TL;DR Knowing what every run did, who changed what, and what every anomaly looks like in context is what makes trust in a platform scale. Operations, anomalies, and admin activity each now have dedicated views with filtering, drill-downs, and live refresh.
What changed
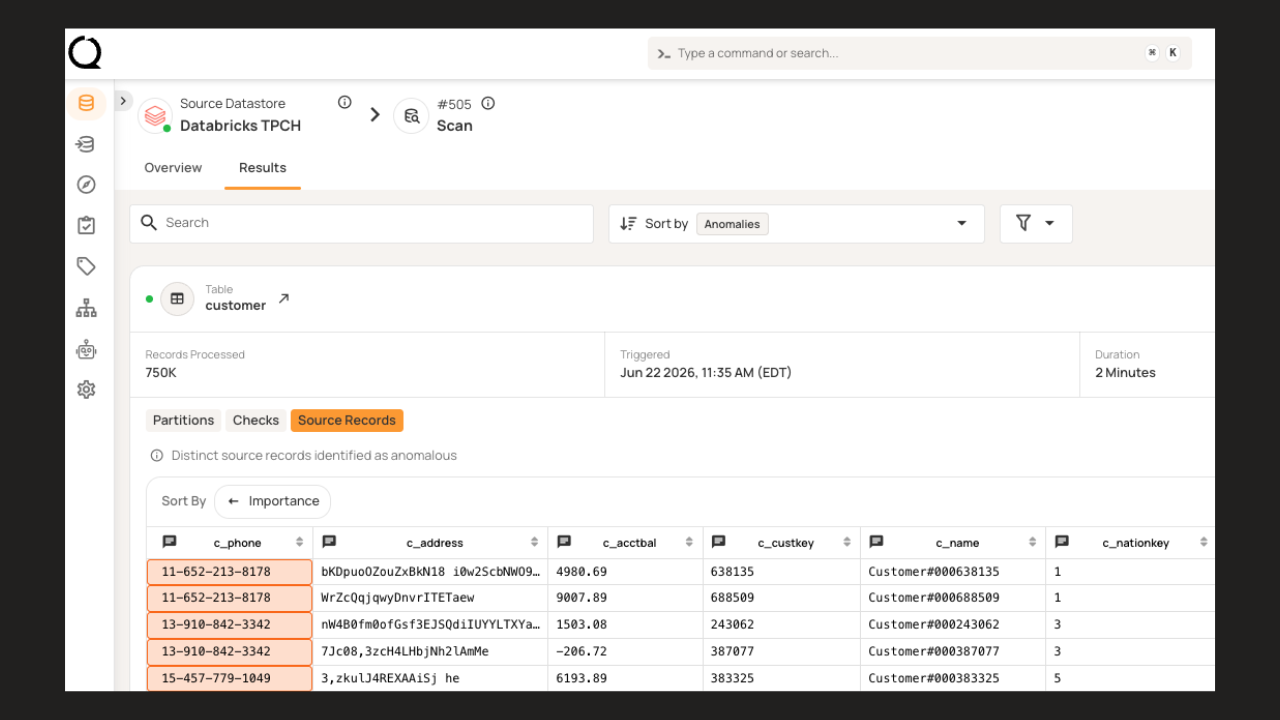
- From run to root cause in one page. Each operation now has a dedicated page with two tabs: Overview, which shows the configuration that drove the run, and Results, which shows what came out of it. From Results, you can drill from partition outcomes to check results to the anomalous records themselves. Anomaly details, Quality Score breakdowns, and field details now all open as right-side panels, keeping the underlying page visible while you investigate. The page refreshes live during the run.
- Audit trail for governance and compliance. A new Audit tab under Settings tracks user actions across the platform, with filters, summary charts, and CSV export. For teams under regulatory scrutiny, this is the paper trail.
New connector, stronger authentication, smarter matching
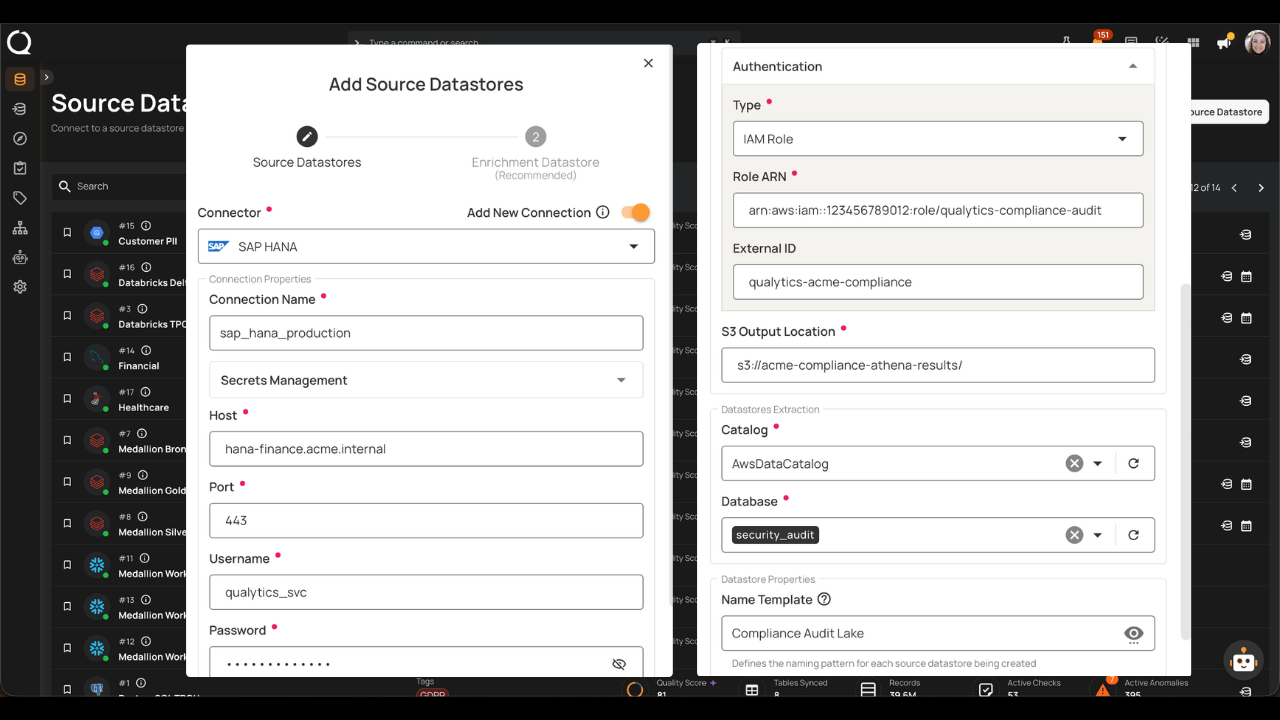
TL;DR SAP HANA datastores now connect directly to Qualytics. AWS customers get IAM Role authentication for S3, Athena, and Redshift. Entity resolution checks now work across multiple fields with configurable match strategies and weighting.
What changed
- SAP HANA connector. SAP HANA datastores can now be connected directly to Qualytics for monitoring and quality workflows. For organizations with SAP in their stack, governed controls are now available to all of your SAP data in HANA.
- IAM Role authentication for AWS. S3, Athena, and Redshift datastores support cross-account access via IAM role assumption. Configure a role ARN, optionally add an external ID, and eliminate the need for long-lived credentials. This is the preferred authentication path for AWS-governed environments.
- Multi-field entity resolution. Entity resolution checks now compare records across multiple fields simultaneously, with per-field match strategies and weighting. Supports strings, numbers, and dates with fuzzy spelling tolerance, numeric proximity, and date range matching. Existing checks migrated automatically with thresholds preserved.
The data control layer only matters if it reaches the systems your teams use and matches their data accurately. Every connector, auth path, and matching upgrade extends the surface where validate-at-use applies.
From principle to practice
April defined the data control layer. May proved it runs at the speed your teams and AI systems already do. The work from here is to keep extending the surface where validate-at-use applies, and to deepen the context every interface can draw from.
Go Deeper
- May 7, 2026 Release Notes
- May 15, 2026 Release Notes
- May 28, 2026 Release Notes
- Qualytics Introduces the Data Control Layer
- Lineage — Getting Started
Questions? Reach out to your Customer Success Manager or contact us at support@qualytics.ai