Learn about the relationship between data governance and quality, including key concepts, implementation examples, and best practices for improving data integrity and decision-making.
Table of Contents
Like this article?
Follow our monthly digest to get more educational content like this.

The need for a more scalable approach to data management has been driven by constant increases in data volume, sources, and consumers, as well as the use of business intelligence (BI) dashboards and AI applications. While data governance and data quality are closely related as means for achieving this goal, they differ in their purpose:
- Data governance defines the business policies, rules, processes, and ownership that guide how data is managed throughout its lifecycle.
- Data quality is about the technical and operational controls that enforce governance and ensure that data is fit for purpose at any point in its lifecycle.
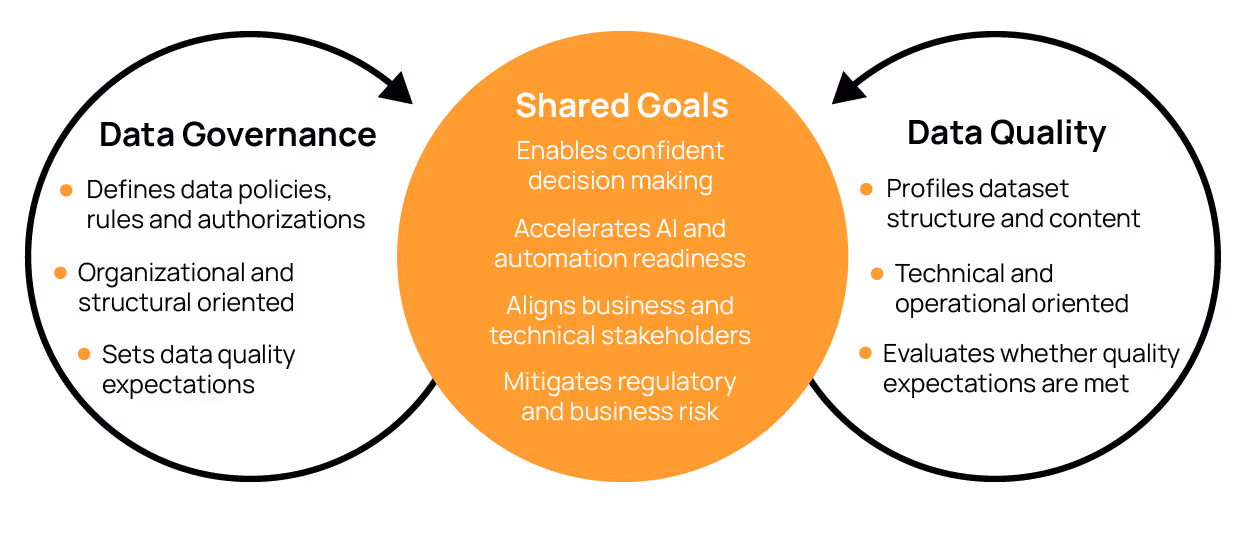
In other words, data governance establishes shared expectations for how data should be managed, while data quality applies technical and operational controls to continuously verify that those expectations are being met. Together, they help preserve data integrity across complex ecosystems of applications, databases, data products, and AI systems, so data remains fit for purpose wherever it is consumed.
This article provides a comprehensive look at the most important aspects of data governance and quality. It begins with thorough discussions of both data governance and data quality, highlighting components, benefits, and uses with the help of an example e-brokerage company. It then moves on to examine the relationship between data governance and quality, looks at best practices for both, and highlights how automation can improve each. The article concludes with an overview of the advantages of using a data quality management tool.
Key concepts in data governance and quality
Understanding data governance
Data governance is the blueprint an organization creates to formally define the balance of control, accessibility, and security for its data. Such proactive data management reduces the likelihood of data-related incidents that require firefighting.
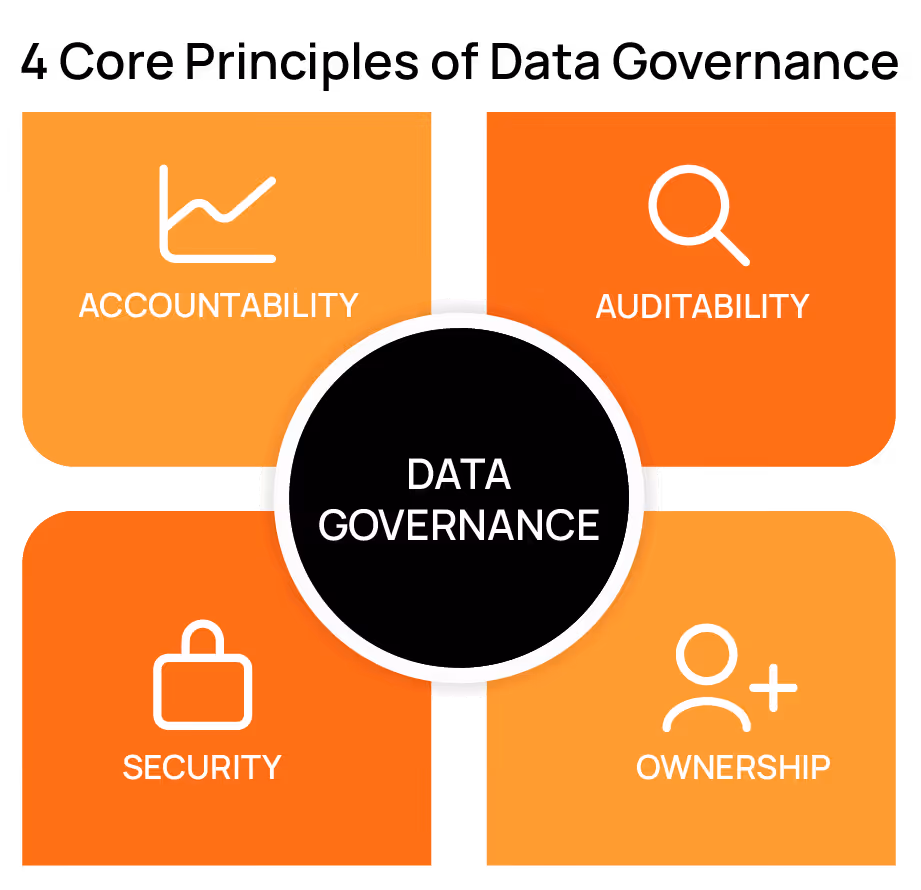
The four core principles of data governance
Data governance comprises four essential principles:
- Accountability: An organization must clearly assign responsibility for each data asset to at least one specific individual or department. When quality incidents or anomalies occur, accountability ensures that the responsible entity investigates the issue.
- Auditability: The ability to trace data from origin to output promotes the quick resolution of inaccuracies and fosters good data-handling practices among teams.
- Security: Organizations must create classification and protection protocols to ensure that only the appropriate person or team accesses data. Unauthorized access to confidential data can lead to data breaches, regulatory compliance violations, and erosion of user confidence.
- Ownership: This refers to the assignment of governance over data domains to individuals or teams. Ownership differs from accountability in that the former determines who sets the rules of a domain, while the latter determines who resolves issues associated with that domain.
These principles are illustrated in the diagram below.
Data governance benefits
Incorporating data governance practices into the data lifecycle and management process provides companies with numerous benefits:
- Legal and compliance: Data governance emphasizes leaving audit trails, which help data management teams establish policies for data access, usage, retention, and privacy to support regulatory compliance (e.g., GDPR). They also enable traceability through documented standards, ownership, and decision records. All of this helps support audits and investigations by clarifying who approved what changes and why.
- Organizational: Proper governance clearly defines data ownership, stewardship, and escalation paths. It reduces unmanaged or “orphaned” data assets through explicit accountability and enables federated data ownership while maintaining shared standards.
- Artificial intelligence and analytics: Data governance defines approved data definitions, metrics, and feature semantics used by analytics and AI systems. It establishes governance for data usage, lineage, and permissible AI applications and clarifies accountability for analytical and AI outputs derived from governed data.
- Business management: Instituting a data governance program protects revenue by ensuring that critical business data has clear ownership and usage guidelines. It reduces costs by reducing ambiguity that leads to duplicated data efforts and rework. It also mitigates risk by defining enforceable policies for security, privacy, and regulatory compliance.
Developing data governance frameworks
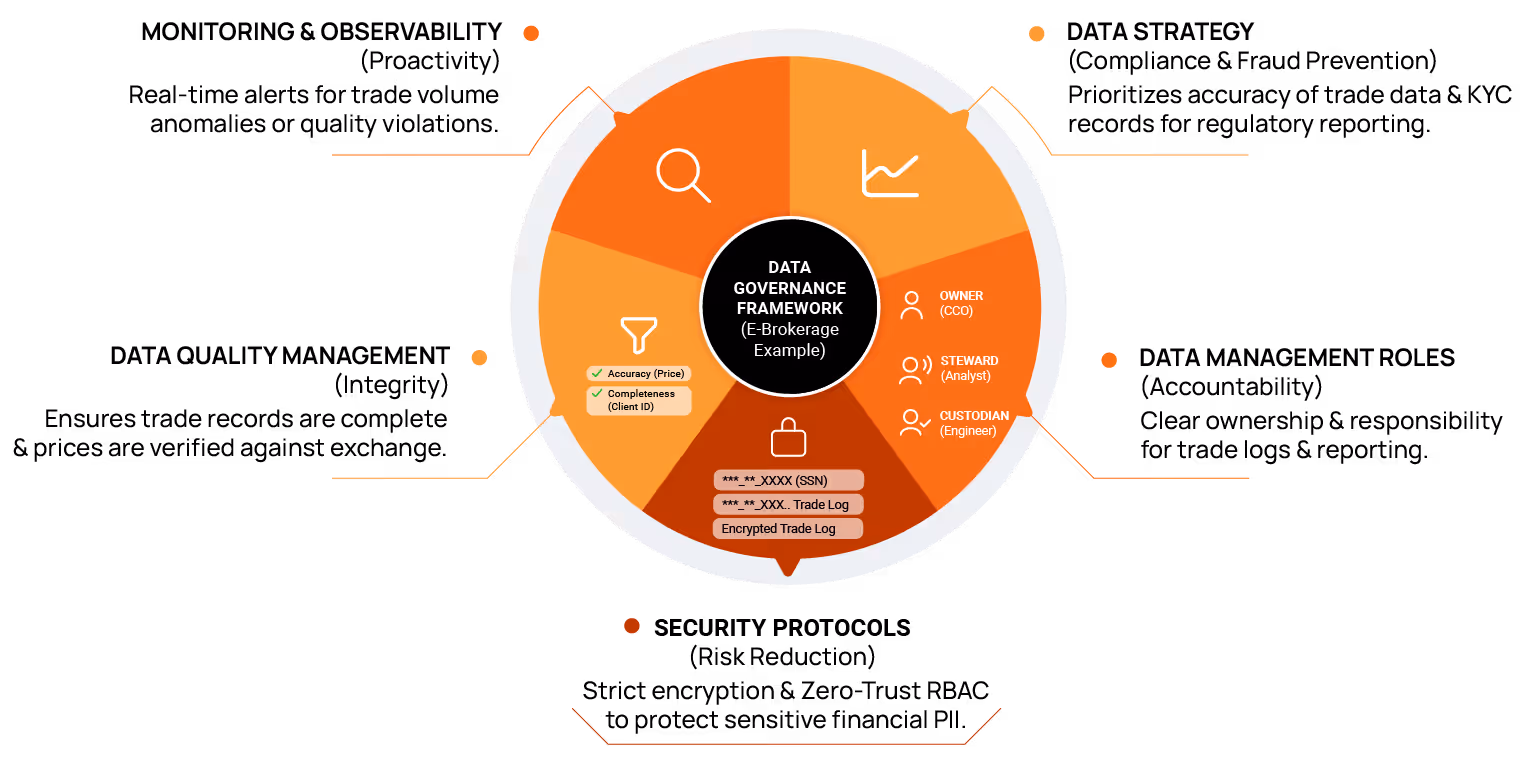
With that backdrop in place, let’s look at how an organization can put governance in place through a data governance framework. These frameworks are documented blueprints that help actualize the four core principles outlined above in the context of the organization's data architecture.
The process is easier to follow with an example. Let’s consider a new e-brokerage company that is about to onboard its first set of customers after a successful marketing campaign. The campaign's results have exceeded expectations, and they are now anticipating a large volume of customer data and initial trades. Given the industry's fast-paced and confidential nature, the technology leadership decides to implement a data governance framework. Here are the actions they would take.
Create a data strategy
The data management team must decide on a data strategy for the organization to follow. A data strategy defines how data usage and collection align with business requirements to optimize storage and value derivation. The team builds the strategy around regulatory compliance and fraud prevention by prioritizing data lineage accuracy and identity verification protocols.
Assign data management roles
The team assigns data management roles to enable accountability and ownership. For example, for all regulatory reporting-related data, they may assign roles as follows:
- Data owner: The chief compliance officer (CCO), who defines data policies for data collection and use
- Data stewards: A few senior data analysts responsible for day-to-day data operations and quality management
- Data custodians: A team of data engineers who manage the technical aspects of security control, data performance, and data retention
When data issues arise, the accountability for resolution lies with stewards to investigate and examine, while custodians implement technical fixes to resolve them. Overall responsibility for strategy, however, lies with the data owner.
Draft a security protocol
The management team develops a security protocol. In the trading and brokerage industry, this is arguably the most critical aspect of a governance framework. For example, they may mark all personal information as confidential and establish an encryption policy and appropriate access controls.
Create data quality management rules
The organization must focus on implementing data quality management rules to proactively prevent data gaps and erroneous data. Rules promote data integrity, increase user confidence, and make regulatory submissions more straightforward.
Here’s an example of an accuracy rule that this firm may want to establish:
The trade price of an order must never deviate from the exchange's recorded price by more than a defined threshold (e.g., 0.001).
Implement data observability
The data governance team works with the engineering team to implement a set of monitoring and observability alerts to identify any anomalies or violations in the data pipelines. For example, the team would likely want to set up an alert to notify data engineers when issues occur, such as trade volume suddenly falling below a benchmark value during peak trading hours. These tools can also inform them of any potential issues with data processing jobs so they can avoid adverse downstream impacts.
{{banner-large-1="/banners"}}
Understanding data quality
As mentioned earlier, data quality refers to the technical and business-focused assessment of data validity, integrity, and accuracy. In modern data-reliant application environments, poor data quality is an analytical, financial, and technological risk. Especially given the shift toward AI and machine learning (ML) models, data quality issues can propagate further: Substandard data quality can lead to flawed training of AI and ML models and provide end-users with inaccurate responses that are difficult to trace back to the original data sources.
The eight key measurements of data quality
Part of the difficulty with describing data quality is that the word “quality” can mean many different things to different people. In fact, quality has several different aspects, or dimensions, that are commonly used for measuring it. Having a good handle on those individual factors gives you a good understanding of data quality in the aggregate.
Let’s look at these eight measurements now, using the e-brokerage company we discussed earlier as an example to clarify the concepts:
- Accuracy measures whether data correctly represents its corresponding real-world entity. Calculating data accuracy requires comparison with authentic sources.
For the e-brokerage company, customer bank details are a critical data component that must be highly accurate to prevent incorrect fund transfers or fraudulent transactions. The company can compute data accuracy by comparing bank records produced by the customer against customer-entered data. Stock prices, which change in sub-second intervals, are another data component that the company should focus on for accuracy. - Completeness judges whether all necessary data values are present in a dataset.
Let’s assume that the e-brokerage firm wants to evaluate the completeness of its customer data to ensure that customers are executing trades within their financial capabilities. When they look, they find numerous entries lackingRisk_Tolerancevalues, as shown in the example table below. A missing entry here prevents the risk calculation engine from deciding whether to allow specific customers to make high-risk trades. In this situation, data engineers should send alerts asking customers to enter these values into their profiles.
- Consistency checks whether data is uniform in terms of value across all operational systems. For example, the firm discussed here would likely want to ensure that
Stock_Pricevalues are consistent across all calculation engines (options, futures, etc.) and application formats (mobile, browser, and desktop applications). - Volumetrics analyzes whether data has been consistent in terms of shape and size over time. For example, if the
Daily_tradestable increases on average by 5,000 rows every day, but on one regular business day it increases only by 100 rows, a volumetrics check would detect this anomaly. - Timeliness measures whether data is readily available at any given time and whether it is fresh and reflects the actual data value at that moment. Looking at
Stock_Priceagain, the e-brokerage firm would like to ensure that the calculation engine populates stock prices every few hundred milliseconds using the most accurate market data feed, so customers always see populated, accurate stock prices (both current and historical). - Conformity assesses whether the data fits the required format and structure. Let’s look at a different view of a set of transaction records held by the brokerage firm (see table below). Here, we see that transactions TRD1502 and TRD1504 follow incorrect date rules, rendering the data invalid: TRD1502 has a transaction date in the pattern “MM/DD/YY” instead of “YYYY-MM-DD”, while TRD1504 has the correct data format but has the month as “45,” which is obviously out of bounds.
- Precision evaluates whether data meets resolution standards, such as decimal places and granularity. For example, if
Stock_Pricevalues start being populated with only 2 decimal places rather than the firm policy’s required 4 decimal places, the relevant precision check will start failing. - Coverage is a “meta-metric” that checks how well monitored a data field is. Fields that meet the required number of quality checks have a 100% coverage rate, while fields that have no active quality checks running against them have a 0% coverage rate.
Data quality benefits
Implementing data quality programs provides the technical and operational controls required to enforce governance expectations and continuously validate data across production environments. Here are some of the key benefits of data quality, organized by function or area:
- Legal and compliance: Good data quality allows organizations to avoid regulatory noncompliance, provides operational evidence that governed standards are being enforced in practice, and surfaces quality issues early to reduce audit risk.
- Organizational: Data ownership becomes actionable through directing quality issues to the appropriate teams. Clear escalation and remediation workflows can be tied to governed datasets, and cross-functional alignment is improved by providing a shared, objective view of data health.
- AI and analytics: Data quality directly translates to high-quality analytics and AI responses based on training data. It enables teams to detect data drift, distribution changes, and anomalies that can degrade model performance. In doing so, it increases confidence to adopt AI and ML across the enterprise.
- Operational: You can reduce manual data validation and incident troubleshooting effort through automation, enforce data standards, and scale data operations without the need for linear increases in the size of engineering teams.
- Business management: Reliable data quality mechanisms protect revenue by preventing faulty business decisions that could result in penalties or customer defection.
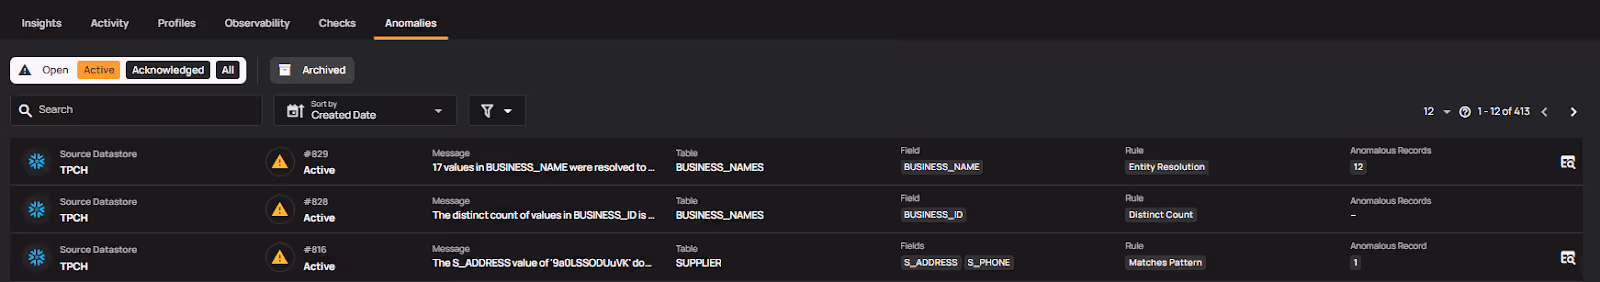
- Anomaly detection: One of the most significant advantages of frequent data quality checks is the detection of anomalies, which are data points that deviate from the “normal” pattern of a dataset. This functionality is valuable because it can detect problems without precedence for which logical validation rules haven’t been implemented. For example, if you examine a dataset of 50,000 purchases at a luxury watch store, and the typical sale price is above $10,000, an anomaly would be a transaction with a sale price of $100.
It’s important to note that anomalies may not always be due to erroneous data but instead could be actual outliers that provide analysts with interesting business insights. Integrating modern data quality frameworks, such as Qualytics, into your pipelines can automate data quality checks and apply business rules to flag anomalous data. For example, the screenshot below, taken from a Qualytics dashboard, shows a list of anomalies detected across all data sources based on automated data profiling (which we will discuss further in the next section). Each row represents a detected anomaly, and clicking on a row drills down into the outlier data along with its context.
How to assess your data quality
The first step towards improving your data quality is to examine and assess its current state. Data quality assessments typically comprise three core operations.
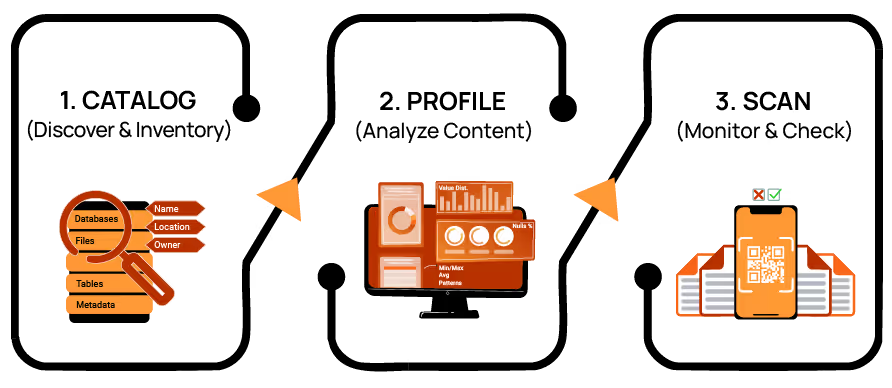
Cataloging
Cataloging is the identification and documentation of all data asset information and metadata to provide engineers with a broad understanding of the data an organization owns, its location, and its basic dimensions. It usually involves the following steps:
- Crawling through data sources to identify all data structures
- Extracting metadata (table names, data types, etc.)
- Preparing and organizing extracted information for profiling and scanning
Ideally, catalog operations should run as soon as a new data source is integrated into your system, so quality assessment procedures stay in sync with your data inventory.
Profiling
Data profiling is the process of examining and gathering statistical data from all datasets within the organization. Here are some examples of what profiling operations include:
- Profiling by content to identify data type distribution, recurring patterns, and outliers
- Statistical profiling to calculate values such as mean, minimum, maximum, and median for a column
- Generation of metadata using the information gathered above to create the foundation for data quality checks
Profiling ultimately gives you a “fingerprint” of your data health and patterns, signaling what quality rules may need to be enforced.
Scanning
After quality rules are established based on governance frameworks or insights are derived from profiling, scanning enforces data quality checks on data collections to assess each collection's quality and identify and document anomalies. This step is the crux of data quality assessment. Scans should be automated and conducted regularly to ensure that data quality is evaluated frequently and accurately, reducing the risk of human error. Typically, users are alerted to the findings via dashboards and alerts.
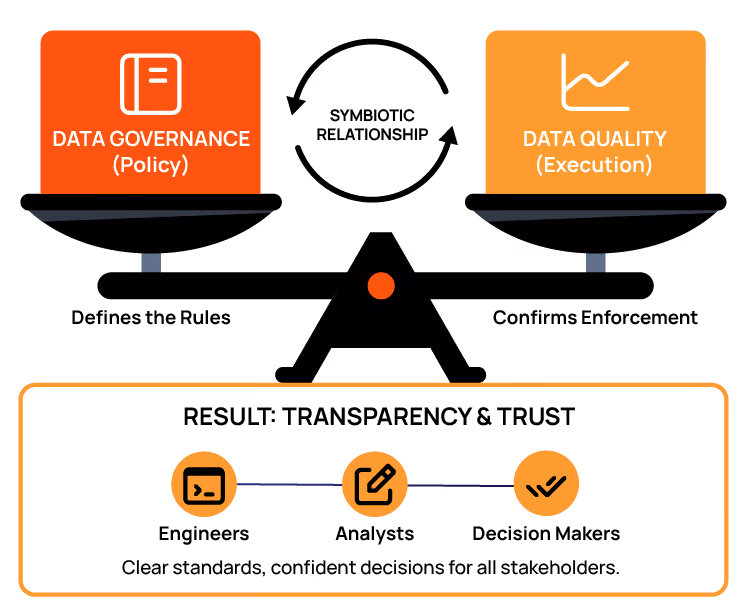
The balance between data governance and data quality
An equal focus on data governance and data quality fosters transparency across the three key stakeholder groups in an organization’s data ecosystem. Data engineers (custodians) are better versed in the required data standards and formats from a technical perspective. Analysts and application owners (stewards) can communicate business expectations to engineers and metrics to data owners. Finally, decision-makers (data owners) can be more confident that their policies are being enforced.
Data governance and quality best practices
While the specifics of data governance and quality are usually unique to an organization’s business nature and data architecture, the following are a few general best practices to help bridge the gap between high-level policy and technical enforcement of rules and checks:
- Shift quality management left: Create a governance policy that implements data quality checks and security protocols as close to the ingestion point as possible (considered to be the “left” side of a data pipeline). The best place to stop data pollution is at the source.
- Standardize business and metric definitions: Ensure consistent quality standards across all firmwide departments by standardizing definitions in governance documentation.
- Plan for automation in governance policies: Factor automated quality checks into governance strategies. Decision-makers should determine the frequency, intensity, and anomaly thresholds of automated quality checks.
- Define remediation steps and escalation plans: Governance policies should not only plan for good data quality but also for what to do when data fails quality checks. Identify accountable parties, create action plans, and analyze anomalous data.
Be mindful that challenges related to scaling or bureaucracy may arise when either governance or quality receives less focus and resources. Here are two examples from our e-brokerage use case caused by an imbalance of focus on either side:
- High-level governance but poor data quality: The e-brokerage firm has comprehensive policy documentation that describes various quality rules and specific management roles, but it lacks the staffing to implement and execute these quality checks. The large number of specific roles has also left most employees confused about their responsibilities. In theory, the company has its data perfectly managed; in reality, pipelines fail every day while engineers are manually firefighting quality issues.
- Strong data quality implementation, but poor governance: The brokerage firm’s engineering team has implemented many sophisticated data quality checks and anomaly detection capabilities. However, the data engineering team has not been fully briefed on which data sources are most important to business analysts. Due to a lack of context and governance roles (owners and stewards), they misprioritized their time investment, spending months implementing checks on data that’s not critical to daily business operations.
Automation to improve data governance and quality
Having humans manually enforce quality checks on petabytes of data is impossible, which is why automating data quality processes is necessary. It provides several benefits:
- It allows teams to replace manual data sampling with self-running, periodic, and concise quality validations.
- Anomaly detection becomes far more comprehensive. Manual rules detect known problems, but automated anomaly detection uses algorithms that go beyond basic rule logic to identify unknown anomalies.
- Automation pays for itself by quickly identifying quality issues and preventing the costs associated with downstream business damage control caused by data problems.
Data quality platforms conveniently integrate into your pipelines and automate various quality checks. The engines that power these platforms gradually understand your application’s data behavior and constantly refine and adjust these inference checks.
Automated reference checks
Modern automated data quality platforms use five typical inference checks:
- Basic integrity checks for the eight fundamental dimensions of data quality (accuracy, completeness, consistency, volumetrics, timeliness, conformity, precision, and coverage).
- Pattern checks validate field formats using regular expressions (regex) and also allow engineers to optionally develop their own regexes without mandating it.
- Time-series checks repeatedly monitor a column's performance to identify deviations, drift, and seasonal patterns.
- Cross-data source checks periodically compare attributes across data sources to ensure consistency.
- Advanced shape checks use ML models to detect subtle, structural changes in data distribution.
These checks, when combined with AI and ML used in the data quality tooling technology, go beyond basic quality checks. They self-learn and can detect the subtlest changes in a dataset, thereby preventing potential production issues.
Examples illustrating manual vs. automated checks
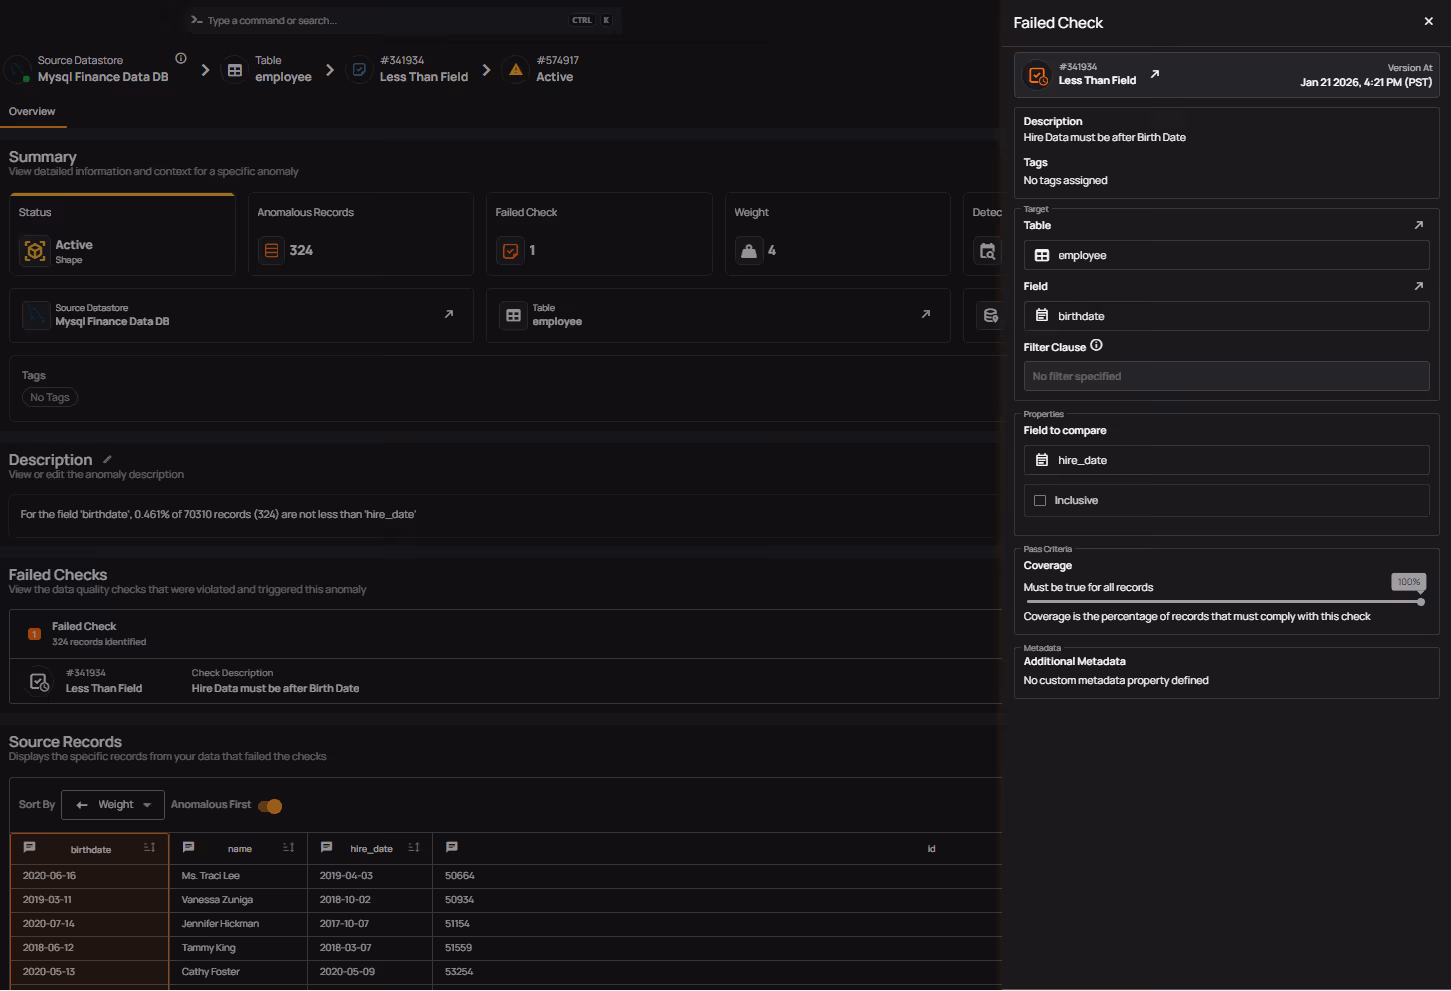
In our first example, data engineers at the e-brokerage company we referenced before want to enforce a check that new company employees have a birth_date that is earlier than their hire_date. This is an important check because the company is rapidly growing, and the compliance division needs to produce accurate data on all employees for market and regulatory boards every month.
To enforce this check, engineers need to write a SQL query similar to the following:
SELECT * FROM HR_Table WHERE Employee_Birth_Date > Hire_Date;They then need to write tests, thinking of all possible edge cases. Following this, they need to follow the entire SDLC process of creating a pull request and so on.
Automated data quality management platforms, such as Qualytics, can uncover or infer the necessity of the constraint birth_date < hire_date by scanning table schemas and using previous records as context. Qualytics automatically deploys the inferred check to a pipeline without requiring any development or fine-tuning, and without posing any risk of disrupting the data pipeline. The automated birth date check would look like this:
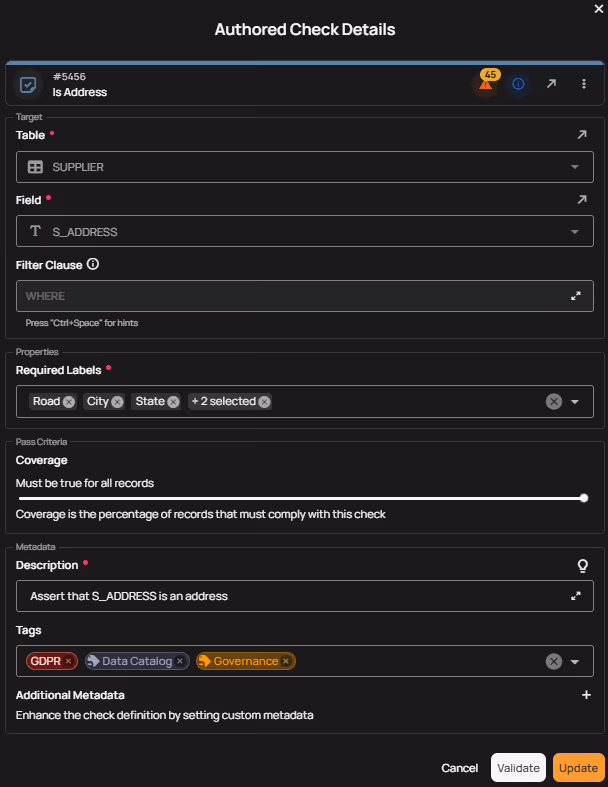
For our second example, consider how global street addresses entered by users into an application can be challenging to map to database fields or data labels like roads, streets, cities, regions, and states. Qualytics uses the open-source tool libpostal to avoid such problems.
Powered by natural language processing and open geodata, libpostal automatically infers and standardizes physical addresses in datasets so that they can be correctly mapped to a database schema. Instead of relying on programming rules, it uses a statistical model trained on global data to understand and correct the unpredictable ways humans write locations in different countries. The screenshot below shows a Qualytics check using the libpostal library to apply and enforce labels such as “Road,” “City,” and “State” on stored addresses.
Essential features of a data quality management tool
In the previous sections, we saw examples of prebuilt data quality checks provided by Qualytics. In this section, we will review the essential features that make it practical to deploy and adopt such a platform in days or weeks rather than months or years:
- Seamless integration: pre-built integrations allow users to add resources to data pipelines with a few clicks. Such integrations include databases, data lakes, and data warehouses (e.g., Snowflake), streaming data sources (e.g., Kafka), third-party tools used to manage the inventory, security, governance, or scheduling of data pipelines (e.g., Airflow), data visualization (e.g., Power BI), agentic workflows (e.g., OpenAI), and remediation (e.g., Atlassian Jira, n8n).
- AI augmentation: Schemas, metadata, and data sources change, and so must data quality checks. Qualytics automates about 95% of typical data quality checks using validation rules that are either prebuilt based on best practices or dynamically generated and maintained by AI and machine learning technologies using your actual data. For example, adaptive baselines can be determined from observed behavior, validation rules can be inferred from data profiles, and anomalies can be detected using learned patterns. Users can dry-run the auto-suggested checks before deploying, refine them through supervised learning, or extend them (optional bring-your-own AI assistants) by integrating via MCP servers and REST APIs.
- Collaboration: Qualytics helps business and data teams share responsibility for data quality by giving them a single platform to define, review, and maintain automated and authored rules, monitor quality and identify anomalies, and take action to resolve issues. As third-party data quality management tools and in-house Python scripts are either integrated or replaced, engineers and operators can trust a single source of truth to measure data quality and respond to tickets assigned to them with impact analysis, priority, operational context, and action items. Meanwhile, executive teams and compliance auditors can rely on unified reports across the entire enterprise.
- Alerting and remediation: Another frequently overlooked benefit of using data quality management tools is their alerting capabilities. With Qualytics, engineers can be quickly alerted through channels such as Slack, Microsoft Teams, and PagerDuty when data quality problems are detected. Each alert has a clear owner, severity, status, context, escalation plan, and auditable trail to streamline operations. Automated remediations that halt the propagation of bad data downstream can be customized using no-code Flows to route incidents, invoke third-party tools, or trigger rollbacks in CI/CD pipelines.
- API Access: In the age of continuous delivery and agentic workflows, data quality management tools must be designed with an extensible architecture in mind. Qualytics’ functionality is accessible via REST APIs, MCP servers, and a Command Line Interface (CLI), enabling seamless integration of data profiling, validation, and monitoring functionality with continuous delivery pipelines, agentic workflows, infrastructure-as-code (IaC), and event-driven DevOps processes.
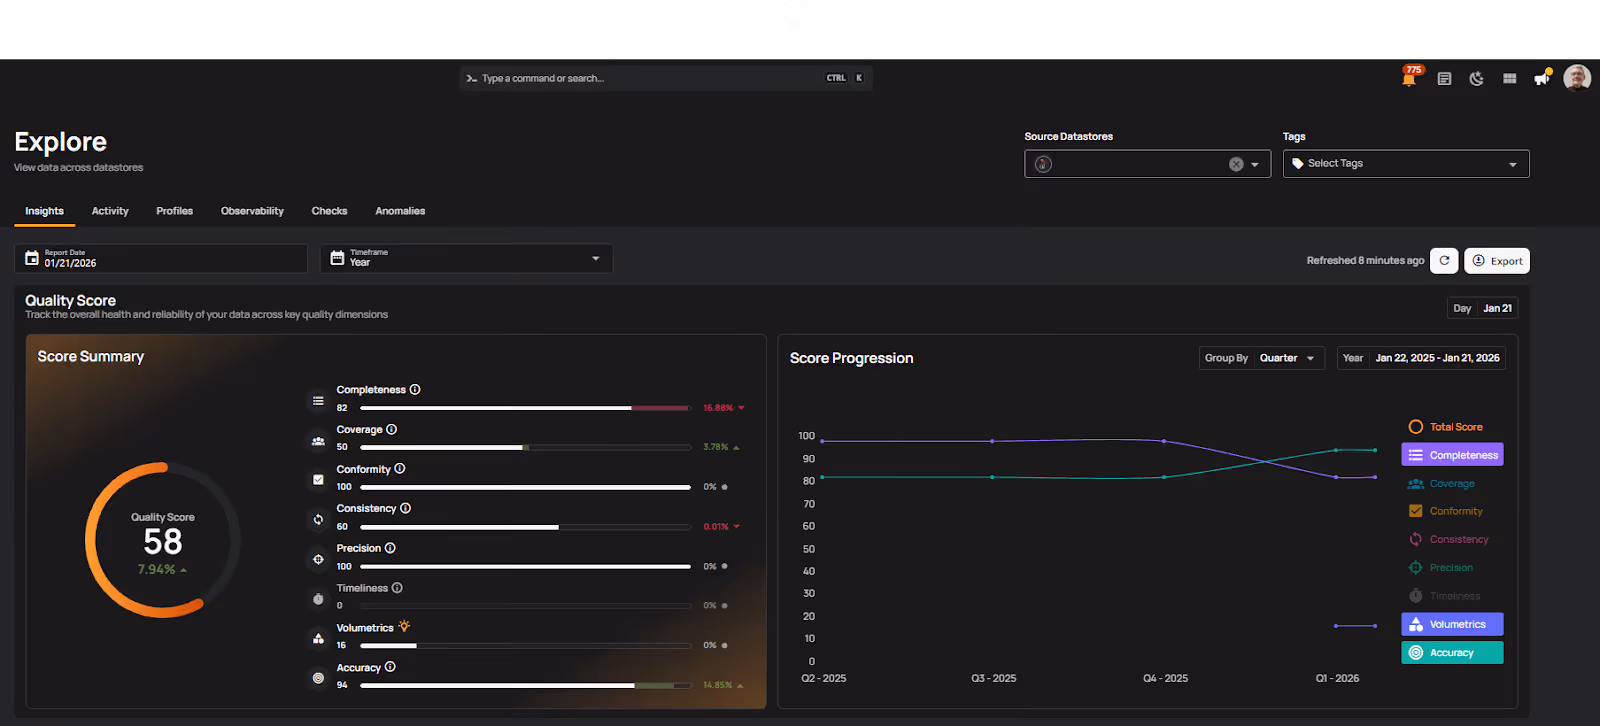
Qualytics maintains the symbiotic relationship between data governance (policy) and data quality (execution), particularly in environments requiring high regulatory compliance. The screenshot below shows a centralized dashboard that provides an executive summary of adherence to policies across a portfolio of disparate applications and data pipelines.
{{banner-small-1="/banners"}}
Conclusion
Data governance and data quality are mutually dependent, and both are required to maintain an organization’s data integrity. Given the scale and complexity of modern data, automation and dedicated data quality management tools are becoming mandatory. A platform like Qualytics accelerates deployment with prebuilt integrations, automates checks, leverages inference for anomaly detection, and provides a collaborative framework to efficiently uphold governance at scale.
Chapters
Improving Data Governance and Quality: Better Analytics and Decision-Making
Learn about the relationship between data governance and quality, including key concepts, implementation examples, and best practices for improving data integrity and decision-making.
Data Quality Checks: Tutorial & Automation Best Practices
Learn the fundamentals of data quality checks, like structural and logical validation, monitoring data volume, and anomaly detection, using practical examples.
Data Quality Assessment: Tutorial & Implementation Best Practices
Learn systematic approaches to assess data quality using automated tools and best practices for reliable validation.
Data Quality Dimensions: A Complete Guide with Examples
Learn the eight data quality dimensions every data engineer needs to ensure reliable, accurate data pipelines.
Data Quality Scorecard: Dimensions, Granularity, and Best Practices
Learn how a data quality scorecard helps you measure, track, and improve your organization's data quality.
What to Look for in Data Quality Software: A Guide to Features
Learn which data quality software features help teams build and sustain scalable, automated quality programs.
From Reactive to Reliable: A Guide to Modern Data Quality Frameworks
Learn the six core components of a data quality framework and how they work together to ensure reliable data.
Data Quality Automation: How Modern Platforms Validate at Scale
Learn how automated data quality platforms infer validation rules, detect anomalies, and support remediation at scale.
Data Validation Software: 10 Must-Have Features to Look For
Learn how to evaluate data validation software using 10 must-have features for scalable, automated data quality.