Learn the fundamentals of data quality checks, like structural and logical validation, monitoring data volume, and anomaly detection, using practical examples.
Table of Contents
Like this article?
Follow our monthly digest to get more educational content like this.

Modern data quality management platforms use statistical profiling, machine learning, and artificial intelligence to automatically generate nearly all the necessary validation rules to detect data quality issues near the sources. However, data engineers must still understand all the factors that can compromise data quality to be prepared to address them.
This article explains the fundamentals of data quality checks, like structural and logical validation, monitoring data volume, and anomaly detection, using practical examples. It also provides engineers with best practices for automating data management workflows.
Summary of key concepts related to data quality checks
Understanding data quality dimensions
Data quality can be thought of in eight dimensions, each measuring a different aspect of reliability. Looking at data through these lenses helps teams catch errors, inconsistencies, and gaps before they impact business decisions. Modern frameworks typically measure data across eight key dimensions to provide a complete view of data health.
Accuracy
Accuracy checks make sure data matches real-world values by comparing it to trusted sources. For example, a retail store might check customer ZIP codes against official postal data, or an online store might compare order totals with payment records. If something doesn't match, accuracy checks catch it quickly, preventing bad data from being included in reports.
Completeness
Completeness measures the percentage of non-null values in fields. Instead of just counting empty spots, good completeness checks look at how much data you expect and spot patterns in what is missing. Completeness also means checking for missing links between tables and missing time periods in the data. Here is an example of incomplete customer data:
Key fields like name, email, and state contain NULL values, which makes these customer records unusable for marketing campaigns and support operations.
Consistency
Consistency checks make sure the same data is represented uniformly across different tables, systems, or sources. For example, a customer should have matching identifiers and attributes across CRM, billing, and analytics systems. If values differ, reports can conflict and downstream joins may break, undermining a single source of truth.
Volumetrics
Volumetric checks analyze consistency in data size and structure over time. They detect deviations in record counts, unexpected drops in table rows, or unusual spikes that may indicate duplicate processing or incomplete extracts.
Timeliness
Timeliness checks track how quickly data is delivered and whether it’s fresh, in line with expected service-level agreements (SLAs). Even if the data is correct, stale data can hurt decision-making. Freshness checks show how old the records are. If upstream systems miss their delivery times, teams get alerts. Timeliness checks help make sure pipelines meet these goals. Here’s a case where delayed data causes problems:
The orders table is 105 minutes stale, exceeding the SLA by a factor of seven. Customer_events is 195 minutes behind, or 6.5 times the allowed lag. Users may believe they are viewing current data, but it is outdated.
Conformity
Conformity checks whether data adheres to required formats, patterns, and business rules. Issues can arise if, for example, a US phone number shows up as “4155550123” in one table and “(415) 555-0123.”
Joins break and records become duplicated in aggregations when the same data types appear in different formats. This leads to inaccurate counts or complete breaks being produced by downstream analytics. Conformity ensures that data follows structural and syntactic standards so it can be reliably processed across systems.
Precision
Precision checks whether field values meet the required level of detail. For numbers, this means checking that values are recorded with the appropriate level of granularity (for example, whole units versus decimals); for dates and times, it checks if the data is recorded in seconds or milliseconds. Precision checks make sure data is detailed enough for its purpose.
Coverage
Coverage measures whether fields have adequate quality checks defined to monitor their health. A field with high coverage has multiple checks validating different aspects of its quality, while low coverage indicates monitoring gaps that could allow issues to go undetected.
{{banner-large-1="/banners"}}
Structural checks: Schema and data types
Having established what to measure, the next question becomes how to enforce these quality standards. Structural checks are your first line of defense against data quality issues caused by schema or type mismatches. These checks confirm that the incoming data matches what you've defined for schemas and types. When breaking changes happen, you catch them early, before they work their way into dependent systems and damage your analytics downstream.
Schema validation
Schema validation catches unauthorized column changes, such as additions, deletions, or modified types, that can cause problems downstream if they are not caught.
Here is an example scenario: An analytics team at a fintech startup builds dashboards using a “customer” table with specific columns. An upstream service adds a mandatory field or renames a column without coordinating. Schema validation finds the problem by comparing the current schema with what's expected. It flags the issue right away, preventing queries from failing and stopping reports from showing bad data.
In this example, here is the expected schema (v1.0):
And here’s the changed schema (v1.1 with an undocumented change):
The email column was renamed to email_address, and a new mandatory subscription_tier column was added without coordination. All downstream queries referencing email would now fail, and ETL jobs would break because they don't provide values for the new required field.
Data type enforcement
Without data type enforcement, fields can contain values that are incompatible with their intended use in calculations. Take a pricing column that gets filled with text values like “TBD” or “contact sales” by mistake. Your SUM operations will either fail or return nulls. Type enforcement flags these problems at ingestion, which means you won't have corrupted data flowing through your ETL pipelines. You can see common type mismatches in this orders table:
Here, the unit_price column contains text strings instead of numeric values, quantity has “three” instead of 3, and order_date has “N/A” instead of a valid timestamp.
Format validation
Format validation uses regular expressions to catch problems like malformed emails, phone numbers, and identifiers before they reach your customer-facing systems. Data like US email formats, Social Security numbers, and phone numbers follow predictable patterns that you can enforce with regex. This example shows malformed data that breaks format rules:
Traditional format validation requires manually writing rules for each field, like regex for emails, phones, or IDs. This SQL, for example, detects invalid emails and phone numbers in the orders table:
SELECT COUNT(*) AS invalid_records
FROM orders
WHERE email NOT REGEXP '^[A-Za-z0-9._%+-]+@[A-Za-z0-9.-]+\.[A-Za-z]{2,}$'
   OR phone NOT REGEXP '^[0-9]{3}-[0-9]{3}-[0-9]{4}$';
Modern no-code and low-code data quality platforms take a different approach. These tools automatically catch schema drift, type mismatches, and format violations. They profile incoming data and identify expected patterns, so teams don't have to manually write structural validation rules.
Integrity checks: Logical consistency
Integrity checks ensure that data is consistent, both between tables and inside each record. These checks find data problems, broken business rules, and missing links that structure checks do not catch. While structure checks look at format and type, integrity checks make sure the data is correct for the business.
Referential integrity and constraint checks
Database constraints are rules enforced at the schema level to maintain data integrity. They include uniqueness constraints for primary keys (ensuring that each record has a unique identifier), foreign key constraints (enforcing valid relationships between tables), NOT NULL constraints (requiring required fields to be populated), and other rules. Among these, foreign key constraints enforce referential integrity, verifying that related records in different tables remain valid and preventing orphaned child records.
Referential integrity checks make sure that links between tables, like parent and child records, stay correct. They stop records from being left without a match when constraints are missing or not properly enforced. The goal is to catch broken links before they cause problems in reports and analytics.
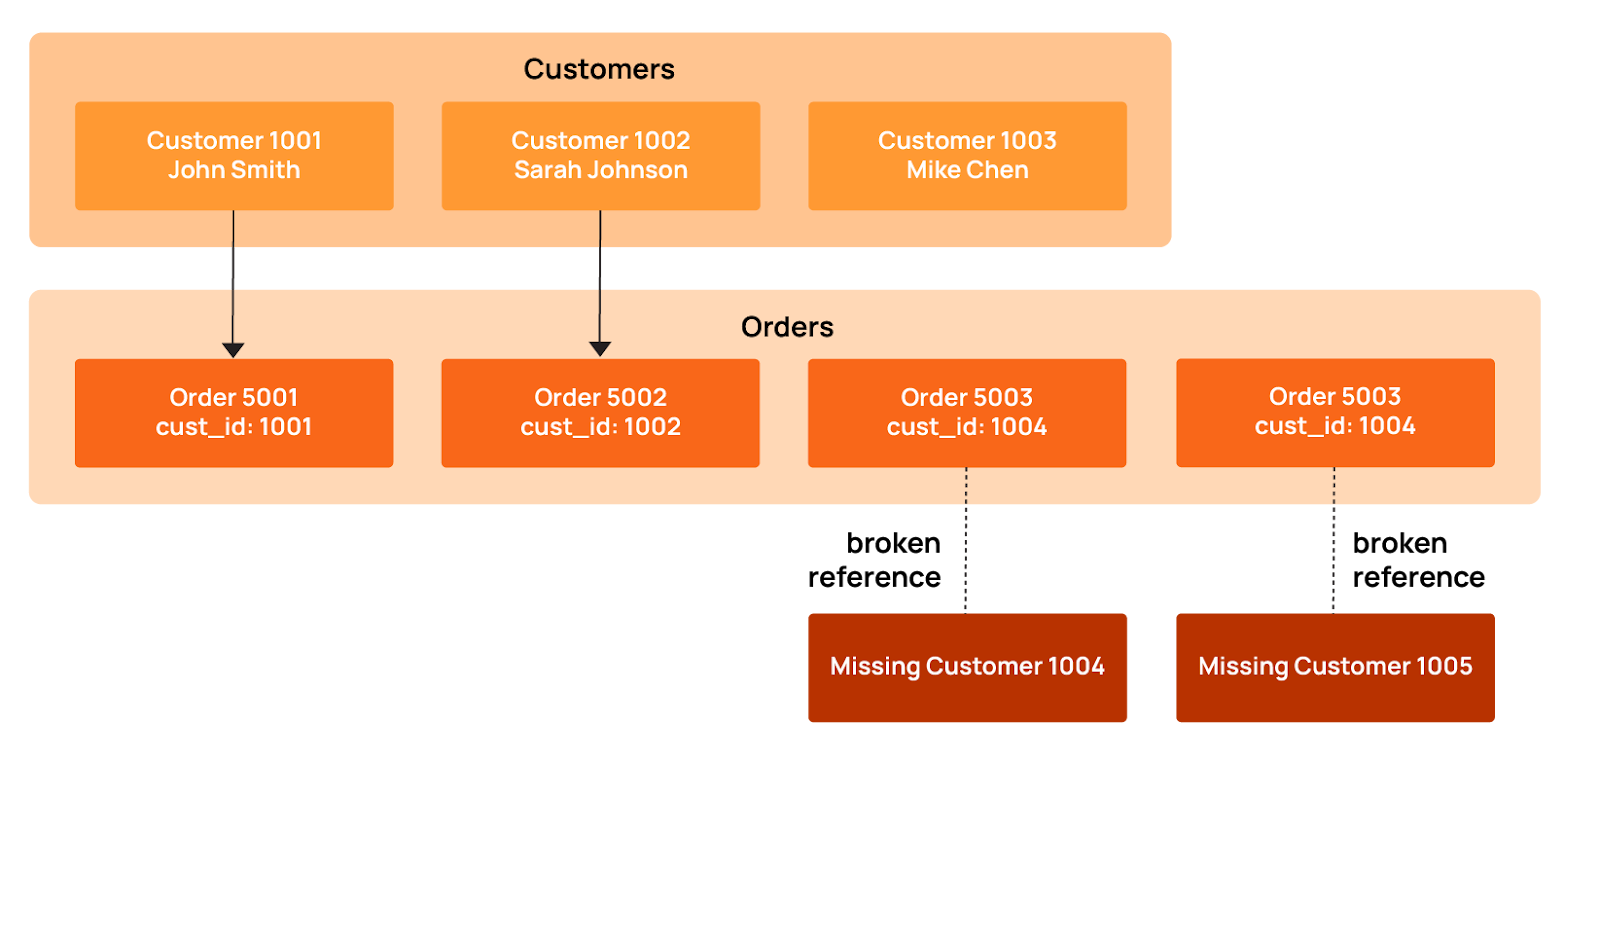
As an example, take an ecommerce platform where every order must link to a valid customer. Without proper constraint validation, deleting customers creates orphaned orders that skew your revenue calculations and distort customer lifetime value metrics. Here is what happens when records are left without a match in an online store:
Orders 5003 and 5004 point to customer_ids 1004 and 1005, but those customers don't exist in the customers table. When records get orphaned like this, they create real problems. This usually happens in a couple of ways. Sometimes customers get deleted, but the system doesn't cascade that deletion to their orders; other times, ETL processes fail to keep referential integrity intact across systems.
The diagram below illustrates how these broken customer-order relationships lead to orphaned records that damage analytics and reporting accuracy.
This SQL example checks for orphaned orders:
SELECT COUNT(*) AS orphaned_orders
FROM orders o
LEFT JOIN customers c ON o.customer_id = c.customer_id
WHERE c.customer_id IS NULL;
Range validation is all about making sure that numeric values stay within the boundaries you'd expect based on business rules and statistical norms. Values outside these ranges point to data entry errors, calculation bugs, or upstream system failures.
Consider this table.
There are numerous range issues here:
- Quantity -25: Negative values indicate inventory tracking errors.
- Prices of $0.00 and $-15.50: Zero or negative prices suggest missing data or calculation bugs.
- Discount 120%: This value exceeds the valid range of 0-100%.
- Quantity 999999: This unrealistic value suggests a placeholder or data corruption.
Range validation rules are typically derived from a combination of business-defined limits and observed historical values. These ranges are then applied automatically to new data during scans, flagging records that fall outside expected boundaries.
Pattern matching
Pattern matching checks ensure that text fields conform to expected structural formats, such as required prefixes, separators, casing, and length. The checks rely on regex patterns that catch variations and malformed strings before they cause downstream problems. Common pattern violations include incorrect separators, missing segments, inconsistent casing, or malformed identifiers. Here are some pattern violations from product SKUs and tracking codes:
The pattern violations here include:
- Product SKU inconsistencies: “widget-b” (lowercase, no year/sequence), “WDG/2025/003” (incorrect separators), “WDG-24-4” (abbreviated year)
- Tracking numbers: “TRACKING123” (doesn't match UPS format), “1Z999AA1” (too short).
- Invoice IDs: “INV20250002” (missing hyphens), “INV_2025_0004” (underscores instead of hyphens), “invoice-5” (lowercase, missing zero-padding).
These inconsistencies break inventory lookups, shipping integrations, and financial reconciliation processes that expect standardized formats. Regex tools like Regex101 and Regexr can be used to develop and test pattern-matching validations.
Cross-field validation
Cross-field validation checks that dependent columns make sense together. Sometimes individual fields look fine on their own, but the relationship between them doesn't add up, usually a sign of data corruption or business logic violations. The table below shows some cross-field issues where the data contradicts itself.
Cross-field violations include:
- Date logic: SUB-002 end_date (2025-01-10) precedes start_date (2025-02-15), creating an impossible timespan.
- Status/date mismatch: SUB-004 shows as “expired” but end_date (2028-01-19) is still in the future.
- Financial inconsistency: SUB-005 payment ($350) exceeds billed amount ($200)
For example, the Qualytics data quality management platform performs cross-field validation by analyzing historical data to learn how related fields normally behave together. The system observes common relationships such as start dates preceding end dates, payment amounts not exceeding billed amounts, or statuses aligning with date ranges, and infers these as logical constraints. Once learned, these constraints are applied continuously to new data, flagging records that break expected relationships without requiring teams to manually define every rule.
Volumetric and freshness monitoring
Volumetric and freshness checks work differently from structural checks: They find problems that other checks might miss by watching how data changes over time. These checks flag outdated data, identify malfunctioning data jobs, and indicate when systems stop sending data. Early detection allows teams to resolve these issues before they impact downstream analytics and business users.
Record count checks
Record count checks compare current batch sizes to historical baselines to catch pipeline problems that often go unnoticed. When daily loads drop below expected ranges or stop completely, these checks flag the issue, which aids in identifying jobs that silently failed.
This kind of issue occurs more frequently than you may imagine. It is possible for nightly data loads to fail without anyone noticing, as shown in the diagram below.
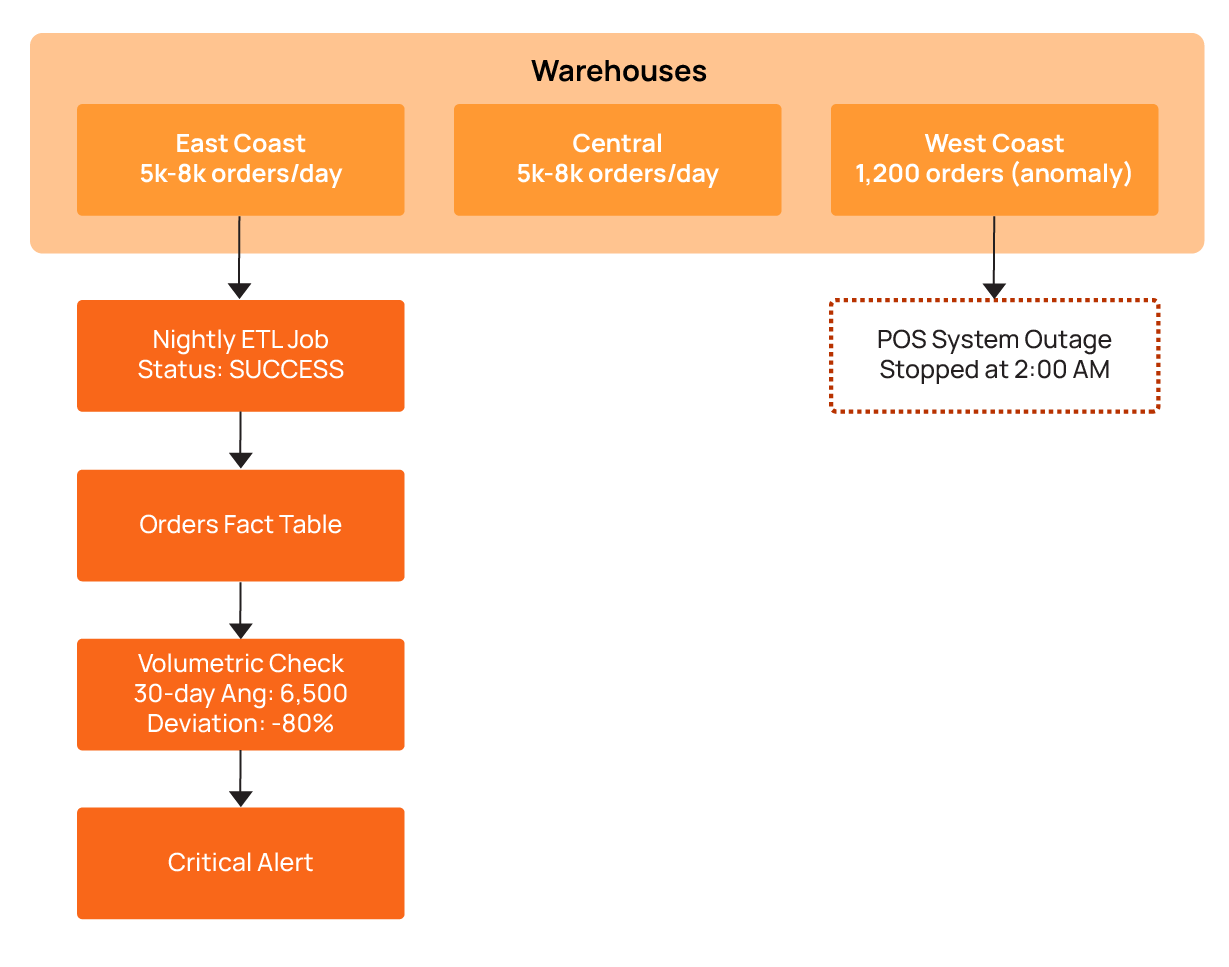
In this scenario, an ecommerce platform processes orders from multiple regional warehouses. Each warehouse generates 5,000-8,000 orders daily. One Tuesday morning, the dashboard shows something odd: Only 1,200 orders came from the West Coast warehouse. No error alerts went off. Why? The ETL job had completed successfully, and everything looked fine on the surface. The volumetric check caught the problem by comparing current counts to the 30-day average. The result showed an 80% drop. That's when the real problem became clear: The warehouse's point-of-sale system had stopped sending data at 2 am (due to a network outage, it turns out).
The table below illustrates the corresponding volumetric anomaly detection results:
Freshness thresholds
Teams need to know if their dashboards show current data. Freshness thresholds send alerts when source systems don't deliver updates on time. Note that freshness and timeliness aren't the same thing: Timeliness looks at individual record timestamps, while freshness monitors when the entire dataset was last updated.
Take a financial trading platform that needs data within 15 minutes. When the most recent trade timestamp goes past that threshold, it means the feed has stalled. The query below monitors data freshness across critical tables.
SELECT 'orders' AS table_name,
       MAX(updated_at) AS last_update,
       TIMESTAMPDIFF(MINUTE, MAX(updated_at), NOW()) AS minutes_stale,
       CASE
           WHEN TIMESTAMPDIFF(MINUTE, MAX(updated_at), NOW()) > 60
           THEN 'CRITICAL'
           WHEN TIMESTAMPDIFF(MINUTE, MAX(updated_at), NOW()) > 30
           THEN 'WARNING'
           ELSE 'OK'
       END AS freshness_status
FROM orders
UNION ALL
SELECT 'customer_events' AS table_name,
       MAX(event_timestamp) AS last_update,
       TIMESTAMPDIFF(MINUTE, MAX(event_timestamp), NOW()) AS minutes_stale,
       CASE
           WHEN TIMESTAMPDIFF(MINUTE, MAX(event_timestamp), NOW()) > 15
           THEN 'CRITICAL'
           WHEN TIMESTAMPDIFF(MINUTE, MAX(event_timestamp), NOW()) > 10
           THEN 'WARNING'
           ELSE 'OK'
       END AS freshness_status
FROM customer_events;
Incremental load validation
Incremental load validation makes sure that the pipeline processes only new or legitimately updated records. It helps teams avoid duplicate inserts or missed changes by checking that the watermark logic and change-data-capture mechanisms are working correctly.
Many ETL pipelines rely on high-water marks that track the maximum timestamp from the previous load to know which records are new. Incremental load validation builds on this by verifying that each batch contains only the expected new or updated records. When this logic breaks, problems occur: Pipelines might reprocess millions of duplicate records or skip recent updates completely. Incremental load validation can catch these watermark issues. By checking actual record changes against expected changes, incremental validation can catch these issues before they propagate downstream.
The example below shows what that looks like:
Load 1003 has a problem: The min_timestamp value is less than the watermark. This means the pipeline went back and reprocessed old historical records. Load 1004 processed zero records, so a batch was missed entirely. Incremental load validation finds these problems by comparing each batch’s records against the previous watermark and expected timestamps. If a batch contains records older than the watermark, it flags them as duplicates, and if a batch contains no records, it flags it as missing data. This way, any issues with reprocessing or missed updates are detected before they propagate downstream.
Advantages of automated rule inference over manual check authoring
As the examples throughout this article show, each type of check requires specific validation logic. For small datasets, writing these manually is feasible, but at scale, the question becomes: Who writes and maintains all these checks?
Engineers can use tools that generate data quality checks automatically using machine learning and data patterns, or they can write them by hand. Automatic checks cover more with less work than manual checks, which are difficult to maintain as expansion occurs.
Limitations of manual check authoring
Writing data quality checks by hand does not scale because large systems can require thousands of rules. For example, hundreds of tables quickly turn into tens of thousands of checks. Data changes faster than teams can maintain it, and different engineers define rules differently. As a result, gaps appear, and bad data slips through.
Statistical profiling
Statistical profiling looks at past data to find normal values and patterns automatically, and it reduces the need to manually design and maintain rules. It checks your real data and creates checks based on what it finds. For number columns, it checks averages, medians, and variation to set limits. For categories, it checks allowed values and how many there are.
Here’s an example for number fields. A retail analytics platform profiles six months of order_total data and discovers the following statistics:
- Mean: $127.50
- Median: $89.00
- Standard deviation: $95.20
- 99th percentile: $450.00
Based on these statistics, an automated profiling system infers checks:
- order_total must be non-negative (observed minimum: $0.01)
- order_total should fall between $0 and $600 (mean + 5 standard deviations)
- It is necessary to flag anomalies when the daily average order_total deviates more than 3 standard deviations from the 30-day moving average
This SQL demonstrates basic threshold inference logic:
WITH stats AS (
    SELECT AVG(order_total) AS mean_value,
           STDDEV(order_total) AS stddev_value,
           MIN(order_total) AS min_value,
           MAX(order_total) AS max_value
    FROM orders
    WHERE order_date >= CURRENT_DATE - INTERVAL 180 DAY
),
thresholds AS (
    SELECT mean_value - (3 * stddev_value) AS lower_bound,
           mean_value + (3 * stddev_value) AS upper_bound
    FROM stats
)
SELECT order_id,
       order_total,
       'ANOMALY' AS status
FROM orders, thresholds
WHERE order_total < lower_bound
   OR order_total > upper_bound
   OR order_total < 0;
Profiling does more than just check number ranges: It analyzes the actual values in text fields to identify dominant formats and common structures. If most values in a column share the same structure (for example, a consistent phone number or product code format), the system infers that structure as the expected pattern and flags new values that deviate from it.
Machine learning approaches
Machine learning works differently from traditional methods. Instead of writing rules for every case, it learns what’s normal from the data itself. The system updates as data changes, so you don’t need to set limits by hand. Machine learning tools look for records that are very different from normal.
Rule-based systems can miss small or hidden problems, but machine learning can find them. For example, it can spot a sudden jump in missing values or flag strange links between fields. It also catches slow changes in data patterns. You don’t need to set limits ahead of time; the system learns what’s normal and watches for changes.
Consider a machine learning system designed to model the typical relationship between order volume and revenue. If the order count is unchanged but revenue declines by 15%, the system identifies a potential problem. Since each individual field appears valid, standard rule-based and profiling checks do not catch it; the anomaly is in the inter-field relationship, which the model tracks continuously.
Hybrid strategies
Hybrid strategies split the work: Automatic checks can handle 95% of the rules, while manual checks are used for the business rules that automation cannot handle. Automated profiling takes care of structure, number ranges, and common patterns. Engineers write the special business rules like “discounts cannot be more than 50%” or “renewal dates must come after the trial period.”
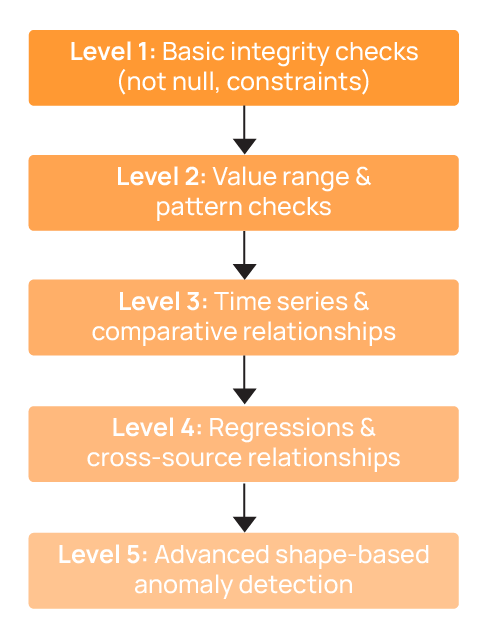
Qualytics has a five-level system that starts with simple checks and goes up to advanced problem detection. The diagram below shows how this works.
Orchestrating check execution and managing anomaly lifecycles
Data quality checks only work if you run them regularly and fix the problems they find. This is what we call the “anomaly lifecycle,” which tracks each issue from detection to resolution. Managing checks across hundreds or thousands of tables requires a clear process: You need steps that find all your data, set what is normal, run checks, and track problems until they are fixed. Without this, you get random scripts that run at odd times as well as alerts that pile up and don’t get fixed.
Catalog operations
Catalog operations scan data sources to find tables and setups. A catalog is essentially an inventory of all tables and fields that might need quality checks. Users can review it and select which datasets to validate. This creates a full list for quality checks, so there is no need to keep lists by hand. The system looks at data details to find what needs checking. Snowflake warehouses, S3 lakes, PostgreSQL databases, and Kafka topics all get found automatically. When new tables are added, catalog operations spot them right away. With the catalog in place, profiling and check execution can start automatically without manual intervention. If setups change, the system finds the change and starts new profiling.
Profile operations
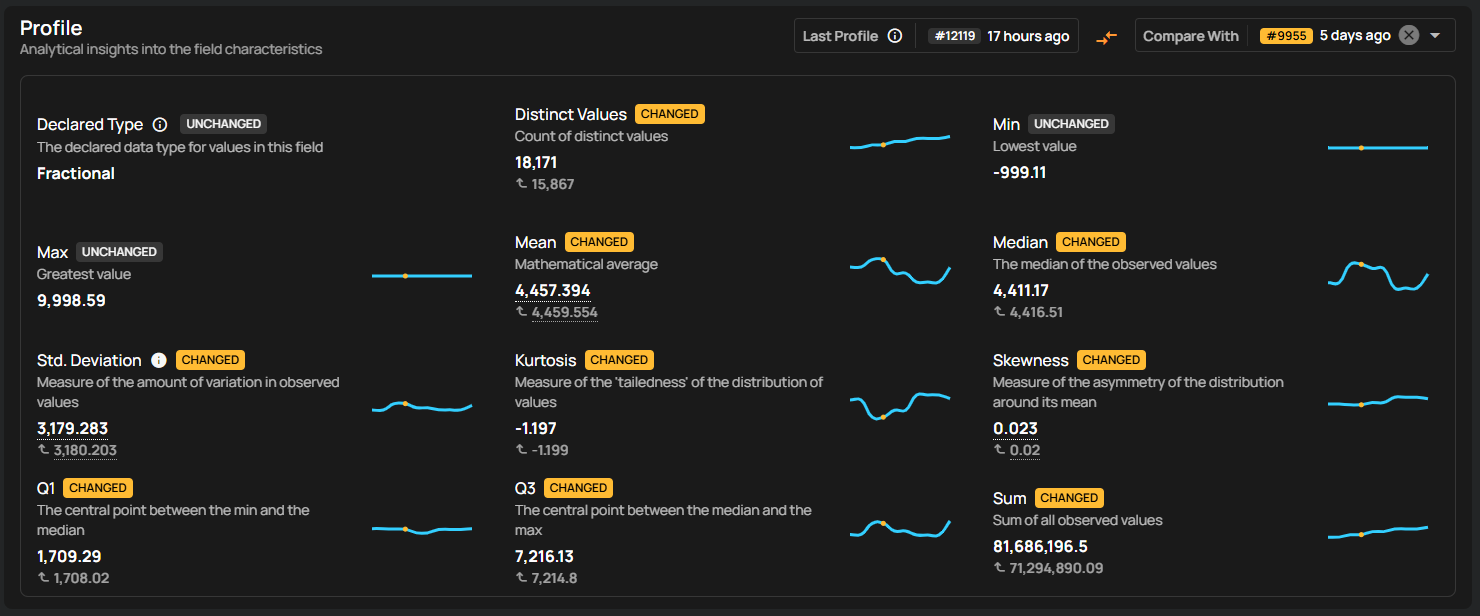
Profile operations collect statistics on each column to understand data distributions and common values. These statistics are then used to automatically define validation checks. For numeric columns, the system calculates minimums, maximums, averages, and standard deviations to generate range checks.
As shown in the screenshot, this example demonstrates how the system profiles the C_ACCTBAL field in the CUSTOMER table, and observes customer balances range from approximately –$999 to $9,998, with a stable mean and distribution shape. The platform establishes a range check to ensure values remain within expected bounds and a not-null check to enforce completeness. Once configured, these checks are executed automatically as part of each scan cycle, continuously validating new data batches and updating rules without requiring manual oversight.
Scan operations
Scans are executed automatically by the system, which applies the validation rules derived from profiling or manual definitions to each dataset. When data violates a rule or deviates from learned patterns, the system flags it as a problem and records it in the anomaly tracking workflow. To optimize performance, the system uses different scanning strategies depending on the context:
Full scans run during initial profiling to establish baselines for all columns and tables.
Incremental scans are applied to daily or periodic ETL loads, checking only new or changed records to reduce compute and runtime.
Sampling scans evaluate a small percentage of very large tables, providing a cost-effective approximation of data quality trends while significantly reducing compute usage.
By automating these scans, the system ensures that checks run consistently, anomalies are captured in real time, and resources are used efficiently.
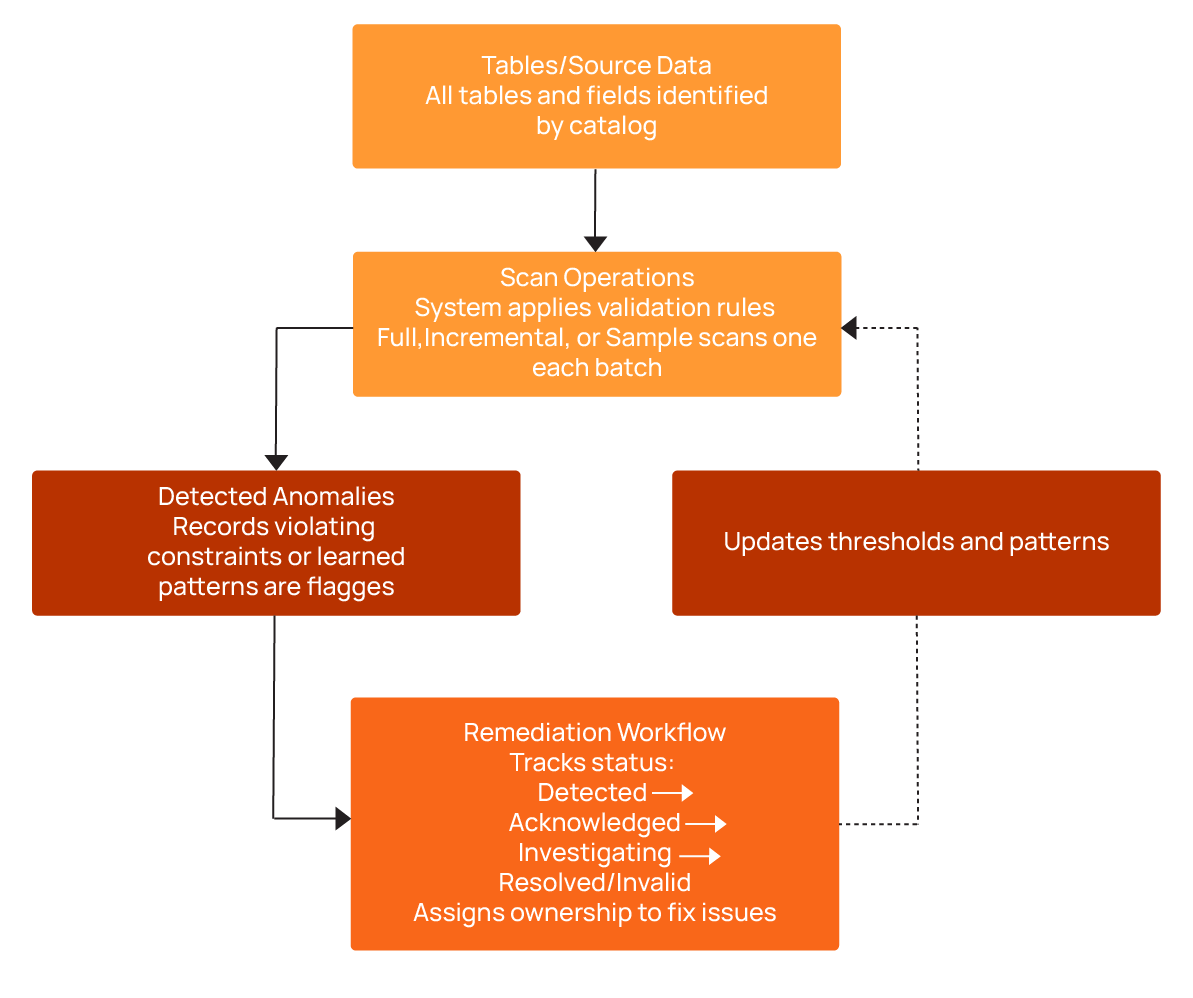
Remediation workflows
Remediation workflows track problems from discovery through resolution. Teams confirm issues, assign someone to fix them, and track progress. Without this, alerts pile up as no one knows which problems matter or who should fix them. Problems go through several steps, with different outcomes depending on the investigation results:
- Detected: Validation rules flag violations with context, including the affected table, column, timestamp, and severity.
- Acknowledged: Investigation is confirmed and ownership assigned.
- Investigating: Owner researches root causes in upstream sources and ETL logic.
- Resolved: Problem is fixed via data correction, pipeline updates, or rule adjustments.
- Invalid: Investigation determines that the data is correct, and the anomaly is used to refine future checks.
Qualytics streamlines collaboration by integrating real-time alerting with major communication platforms like Slack and Microsoft Teams, as well as ticketing systems such as Jira and ServiceNow. Each alert includes essential governance features, including escalation plans and audit trails. The platform utilizes customizable no-code Flows that automatically trigger remedial action to halt downstream data propagation, manage incident routing, or execute pipeline rollbacks.
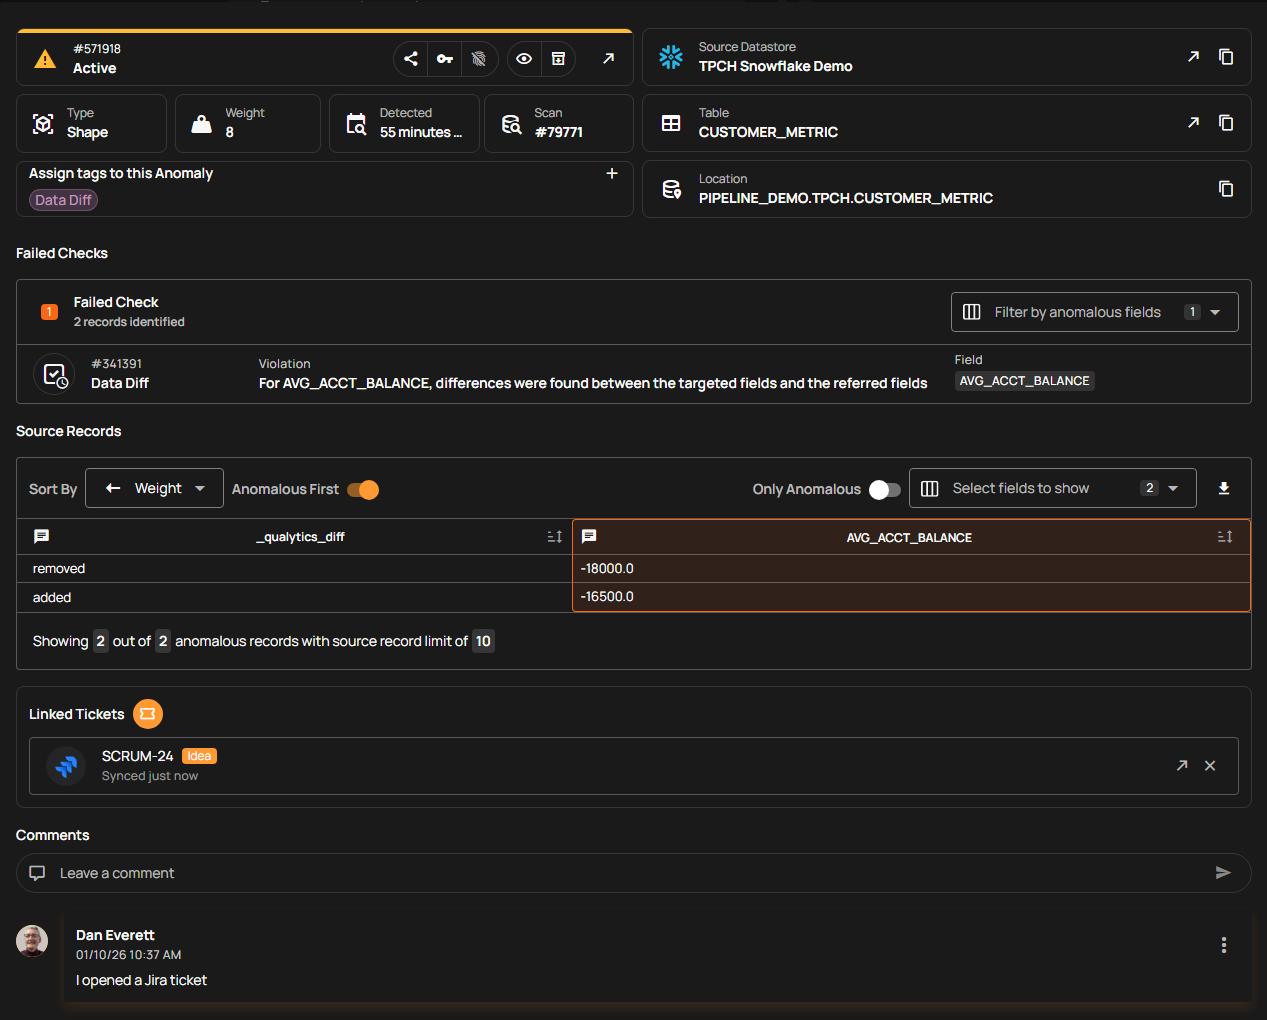
Qualytics offers all of its functionality via APIs, a command-line interface (CLI), and an MCP server (used by AI agents) for integration with operational workflows and CI/CD software release management models. This helps teams move from reacting to problems to programmatically detecting and addressing data pipeline issues before end users notice them.
{{banner-small-1="/banners"}}
Last thoughts
As systems grow, teams must balance how much they check, how quickly things run, and the effort required for data quality checks. At first, simple manual checks are enough, but as data grows and spreads across more systems, automated profiling becomes increasingly necessary to maintain trust in the data. When teams share dashboards, centralized tooling, and end-to-end views of data quality, they can better collaboratively manage data health.
Chapters
Improving Data Governance and Quality: Better Analytics and Decision-Making
Learn about the relationship between data governance and quality, including key concepts, implementation examples, and best practices for improving data integrity and decision-making.
Data Quality Checks: Tutorial & Automation Best Practices
Learn the fundamentals of data quality checks, like structural and logical validation, monitoring data volume, and anomaly detection, using practical examples.
Data Quality Assessment: Tutorial & Implementation Best Practices
Learn systematic approaches to assess data quality using automated tools and best practices for reliable validation.
Data Quality Dimensions: A Complete Guide with Examples
Learn the eight data quality dimensions every data engineer needs to ensure reliable, accurate data pipelines.
Data Quality Scorecard: Dimensions, Granularity, and Best Practices
Learn how a data quality scorecard helps you measure, track, and improve your organization's data quality.
What to Look for in Data Quality Software: A Guide to Features
Learn which data quality software features help teams build and sustain scalable, automated quality programs.
From Reactive to Reliable: A Guide to Modern Data Quality Frameworks
Learn the six core components of a data quality framework and how they work together to ensure reliable data.
Data Quality Automation: How Modern Platforms Validate at Scale
Learn how automated data quality platforms infer validation rules, detect anomalies, and support remediation at scale.