A look at the ten Qualytics features shipped in 2025, built to help data quality teams operate at scale and support AI, governance, and analytics.

Jan 14, 2026
5
min read
Table of Contents

Over the past year, we expanded the Qualytics platform with capabilities data quality teams rely on every day such as operational workflows, scalable rule management, clearer visibility into how data is changing, and deeper integrations across the data stack. These improvements support practical, production use cases, from AI assistants and agents to reporting, reconciliation, governance, and compliance.
Below is a look at 10 features we delivered in 2025, grouped by what they enable and how teams are using them in production today.
Workflow & Operations
Making data quality management faster and easier
1. Flows
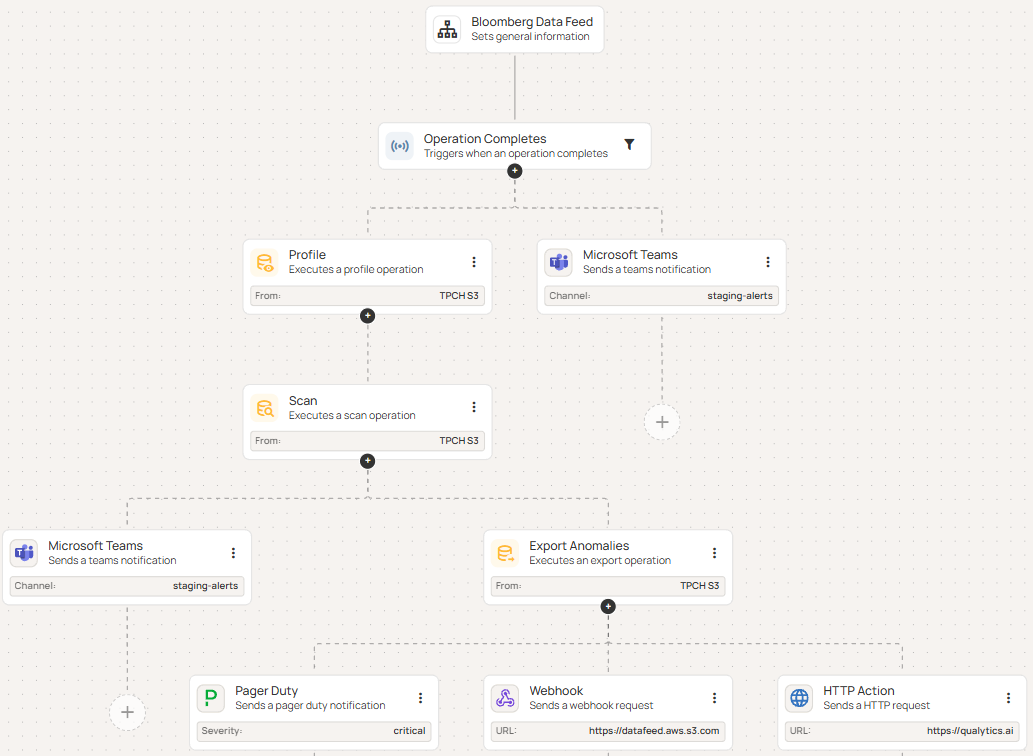
Flows give teams a way to define and orchestrate remediation workflows - whether complex or basic - and ultimately automate data quality processes across data pipelines. Each Flow is a chain of connected steps that run automatically when triggered, from scanning data and profiling tables to alerting the right people when something breaks.
Flows improve remediation processes by:
- Automatically running follow-up operations when specific events occur.
- Ensuring all datastores follow the same workflow and rules.
- Notifying teams instantly about scan results or detected anomalies.
- Centrally managing triggers and actions
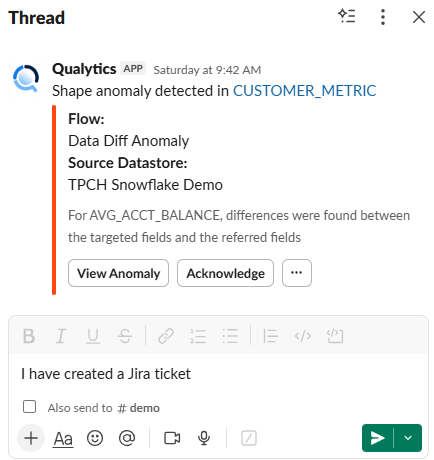
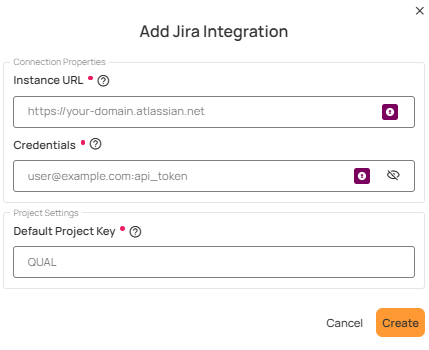
2. Alerting & Ticketing Integrations
The Qualytics platform integrates with popular enterprise messaging and ticketing platforms, such as Slack, Microsoft Teams, Jira, and ServiceNow to enable two-way, real-time communication and collaboration about data quality events.
These integrations enable teams to:
- Receive instant notifications when data quality issues are detected.
- Track and manage data quality anomalies within existing ticketing tools.
- Share operational status updates and system health notifications.
Scale & Reuse
Managing data quality across large, complex environments
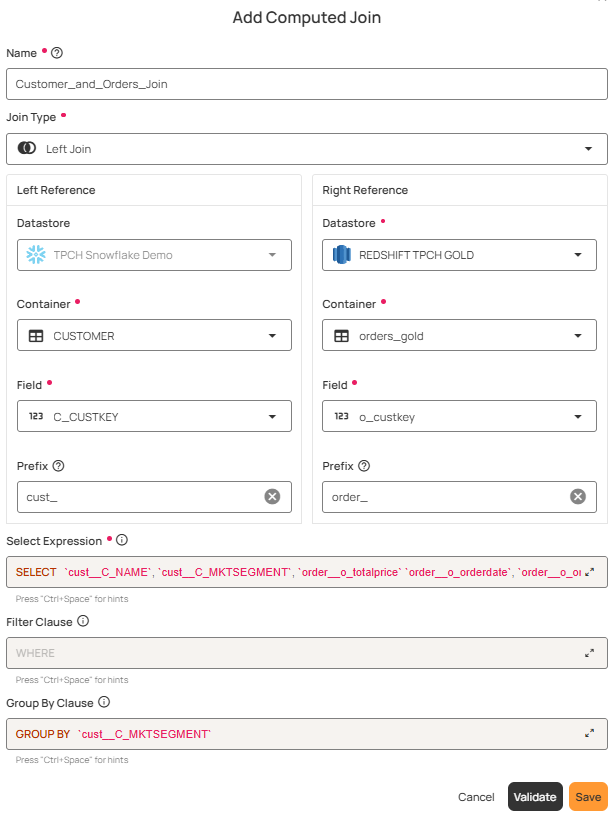
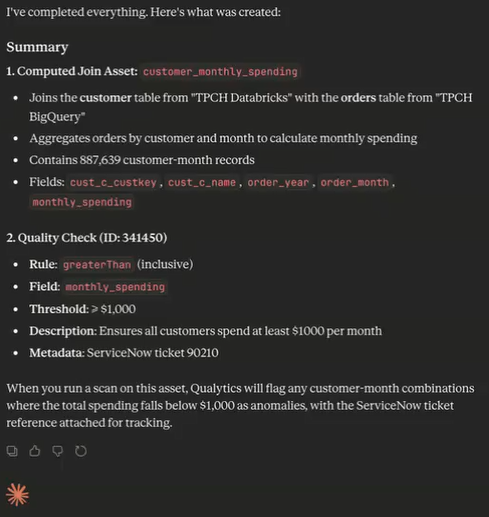
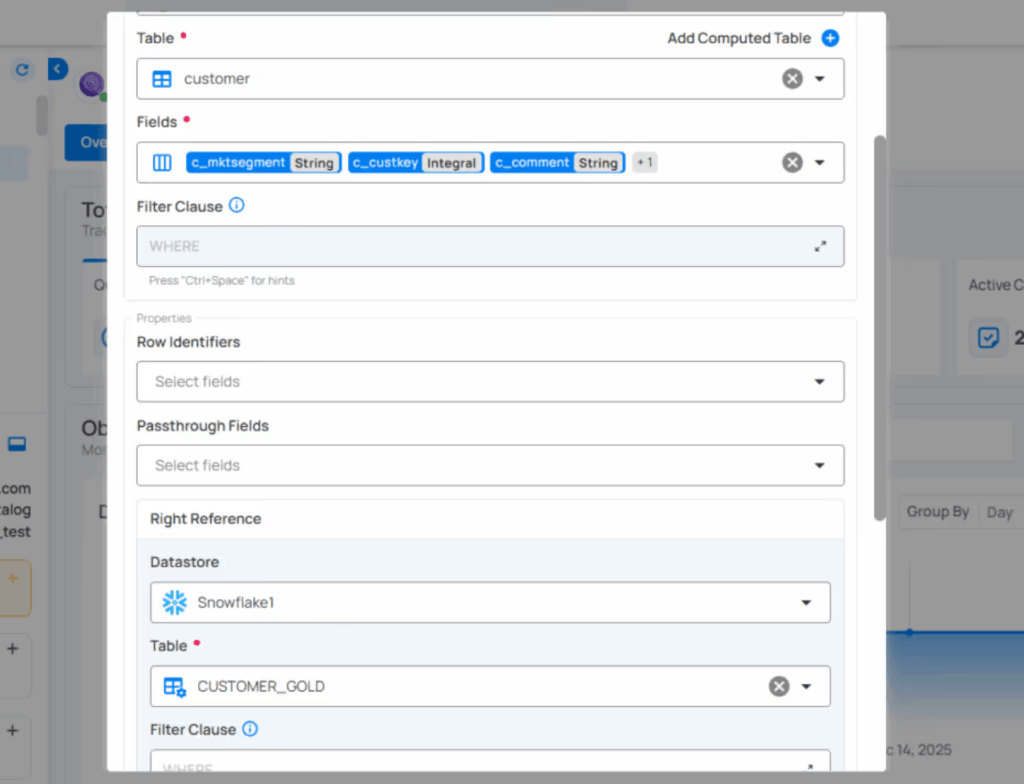
3. Computed Joins
A Computed Join container allows you to combine data from two different source datastores (e.g., a database table vs. a file system container). You can choose the join type (Inner, Left, Right, or Full Outer) and apply transformations, filters, and custom queries to the joined result.
This feature is useful when you want to:
- Merge information from multiple source datastores into a single dataset.
- Perform cross-datastore analysis (e.g., JDBC tables with DFS files).
- Apply Spark SQL transformations and filters on top of the joined data.
4. Check Templates & Bulk Creation
Check Templates empower users to efficiently create, manage, and apply standardized checks at scale. Users can create hundreds of checks in the UI by configuring a single template. The new each() functionality enables a single template to automatically create multiple checks - one for each value in a provided list - without manually defining separate checks.
These features enables teams to:
- Bulk-create large numbers of checks directly from the UI using a single template.
- Define and manage data quality checks independently of specific datastores, containers, or fields.
- Use each() to systematically apply the same validation logic across multiple values of a field or attribute.

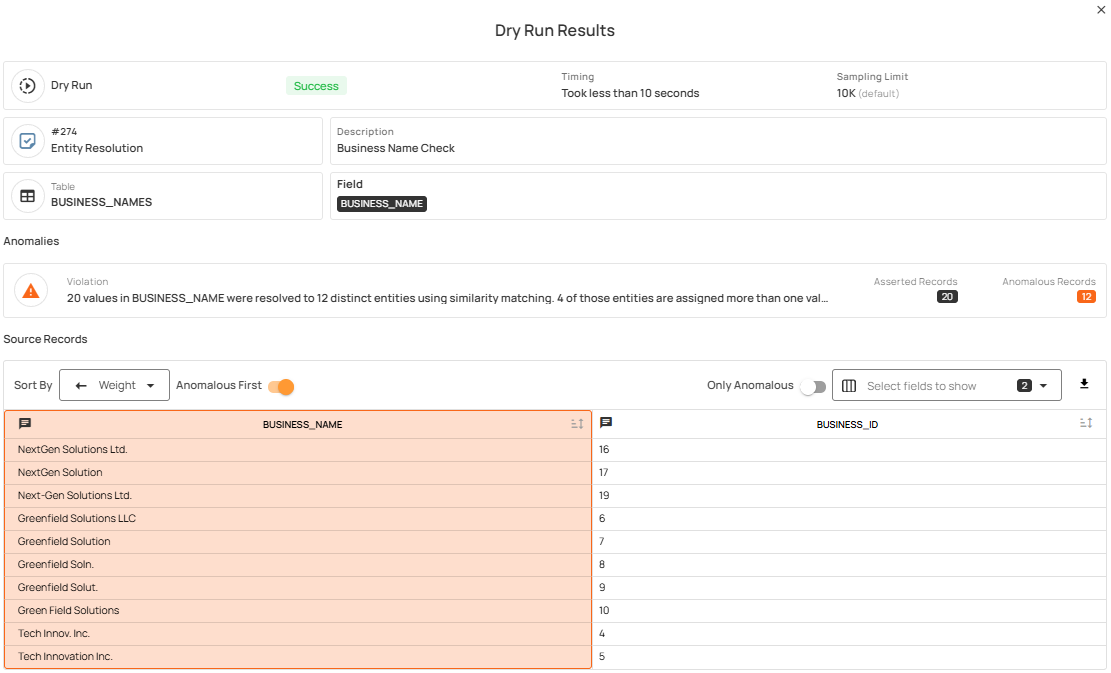
5. Dry Run for Checks
Dry Run allows teams to test checks and preview results before activating them. Checks can be validated, tuned, and reviewed without generating anomalies or impacting production workflows.
This feature help teams:
- Define and manage data quality checks independently of specific datastores, containers, or fields.
- Reuse standardized validation logic across many datasets without rewriting rules.
- Reduce manual effort and improve consistency as data environments scale.
Visibility & Measurement
Understanding data quality and how it’s changing
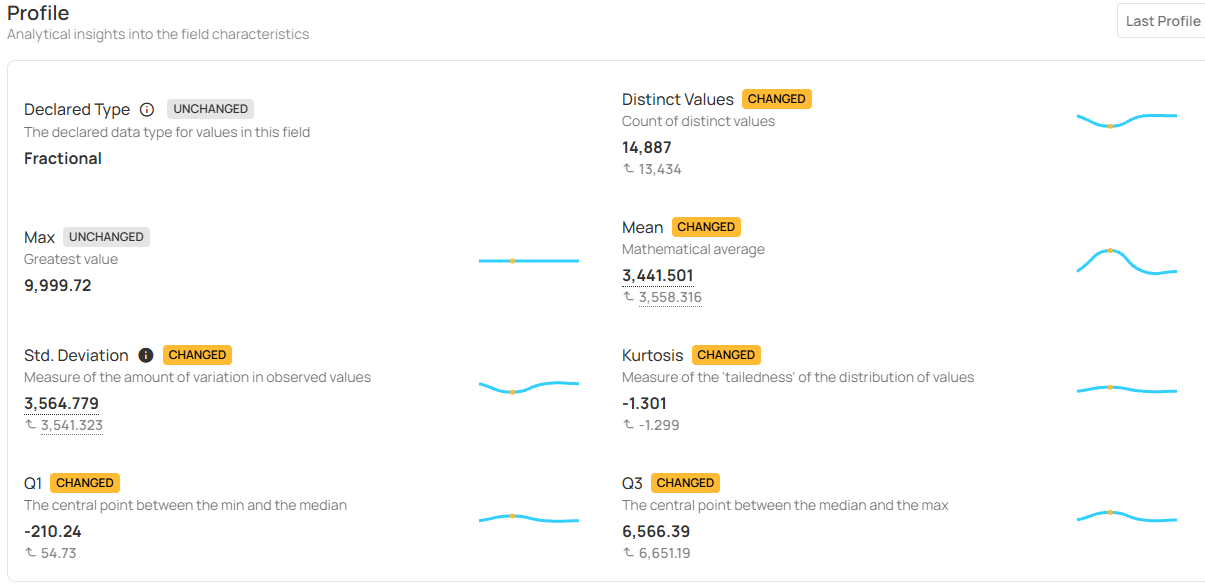
6. Profiles Over Time
Profiles Over Time enable teams to track how field-level characteristics evolve across profile runs, providing visibility into subtle and systemic data changes.
Use this feature to:
- Compare current and historical field profiles to identify changes in statistical metrics and distributions.
- Identify data drift, value shifts, and type changes using visual indicators and trend charts.
- Quickly spot impactful schema or field-level changes through clear badges and highlighted deltas.
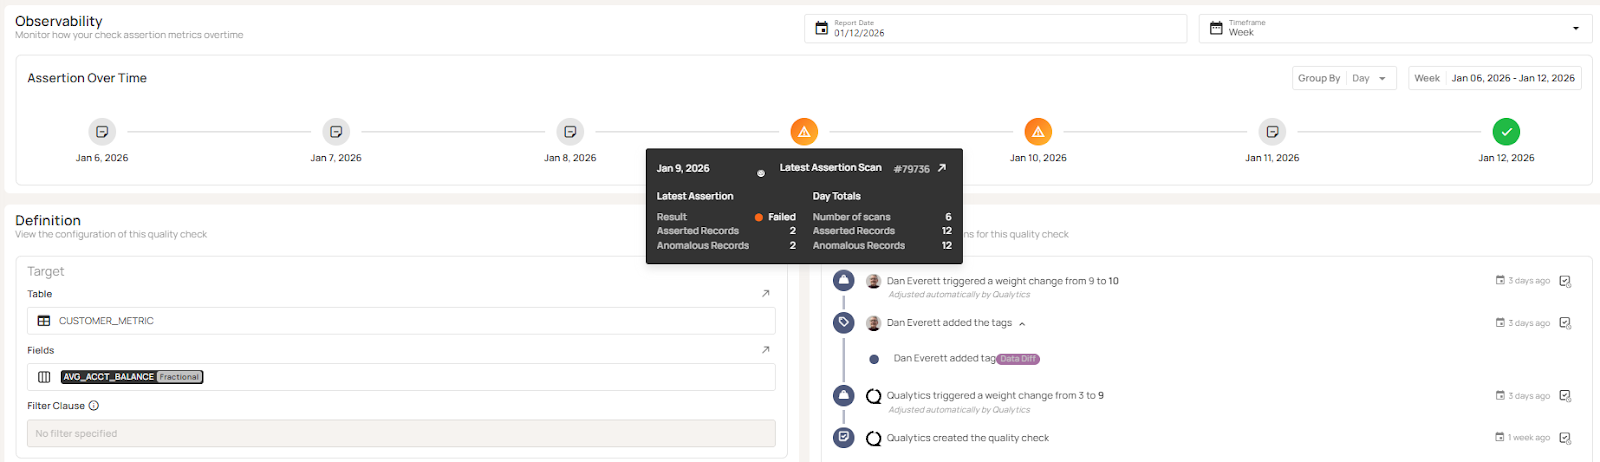
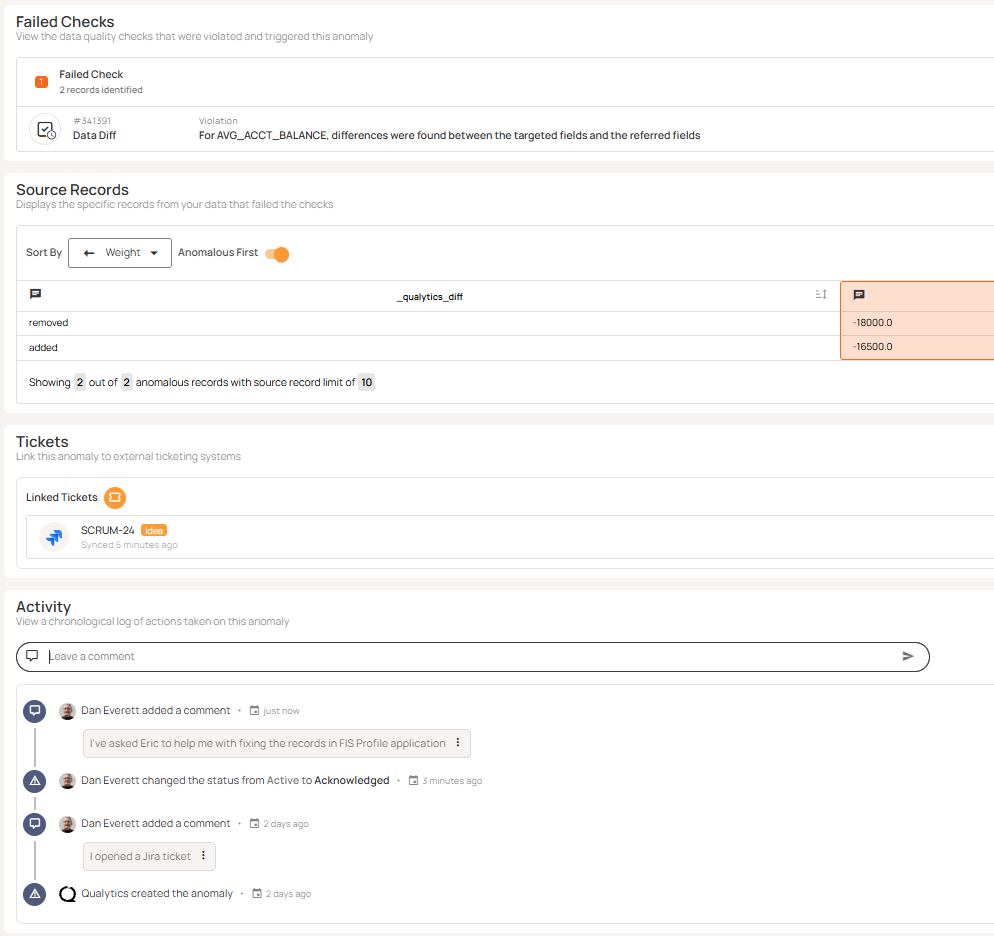
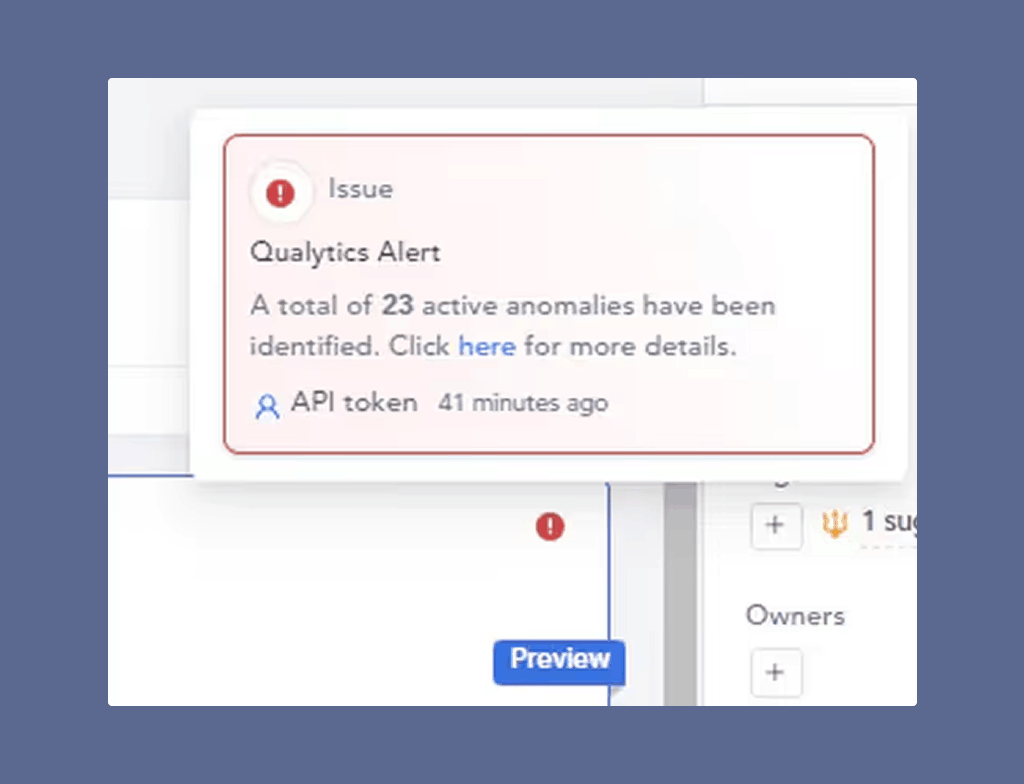
7. Check and Anomaly History
Check and Anomaly History provide detailed observability, version history and activity information about data quality checks and data anomalies managed in Qualytics.
Check History provides:
- Visibility of check assertions over time.
- Drill down into specific scan results.
- Check version history and configuration changes.
- Full exportable audit log
Anomaly History provides:
- When an anomaly was created.
- Changes to status and who changed the status
- A chronological list of comments between stakeholders.
- Full exportable audit log
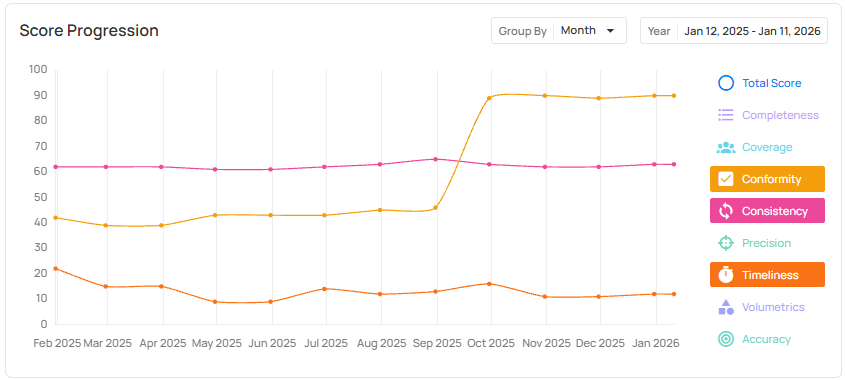
8. Quality Dimension Line Graphs
Quality dimension line graphs show how data quality changes over time across individual dimensions such as completeness, coverage, conformity, and consistency. Rather than relying on a single aggregate score, teams can track and compare trends at the dimension level to understand where quality is improving or degrading.
This feature is useful when you want to:
- Identify which specific quality dimensions are driving overall score changes.
- Distinguish systemic data issues (e.g., missing data or consistency drift) from isolated anomalies.
- Focus remediation efforts on the dimensions that most impact downstream reporting, reconciliation, and analytics.
Ecosystem & Extensibility
Bringing data quality into the broader data stack
9. Agentic API & MCP Server
The Agentic API and MCP server enable external AI systems and agents to invoke data quality actions in automated workflows, including triggering scans and checks, retrieving quality scores and anomaly context, and initiating remediation workflows.
These features are useful when you want to:
- Integrate Qualytics into agent-based systems, automation frameworks, or custom applications.
- Programmatically trigger data quality operations or retrieve quality context as part of broader workflows.
- Extend data quality controls into advanced use cases, including AI-driven processes, without manual intervention.
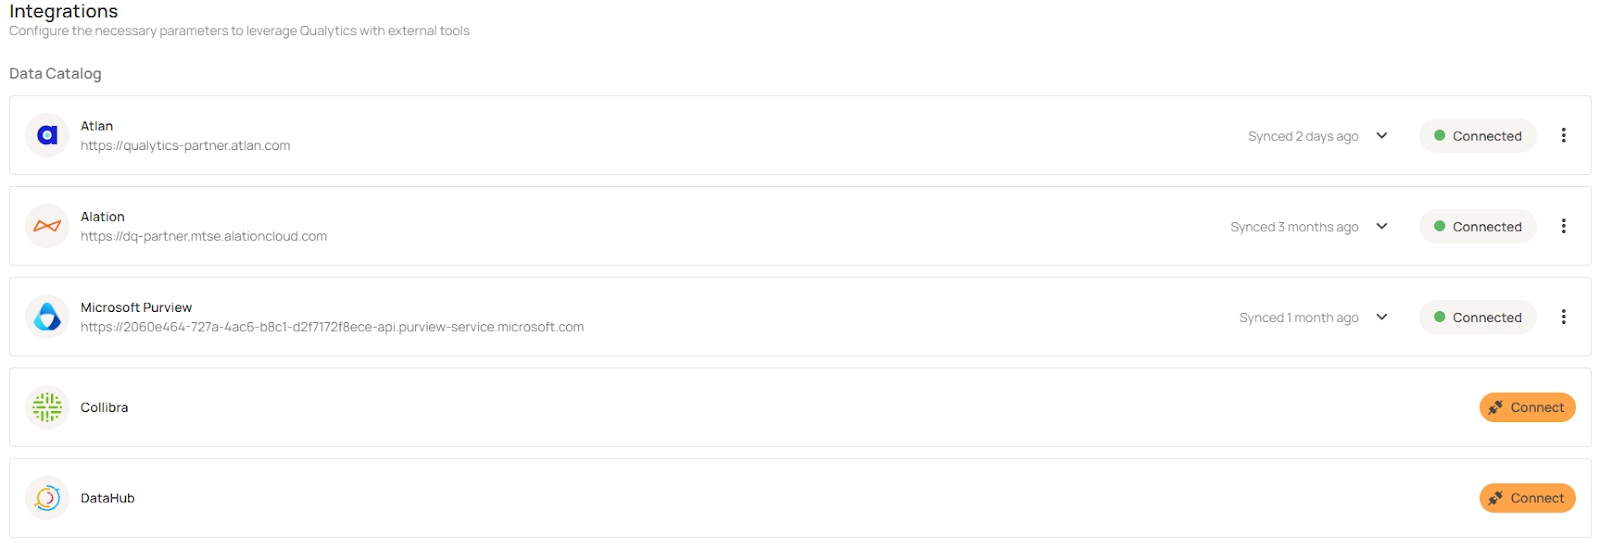
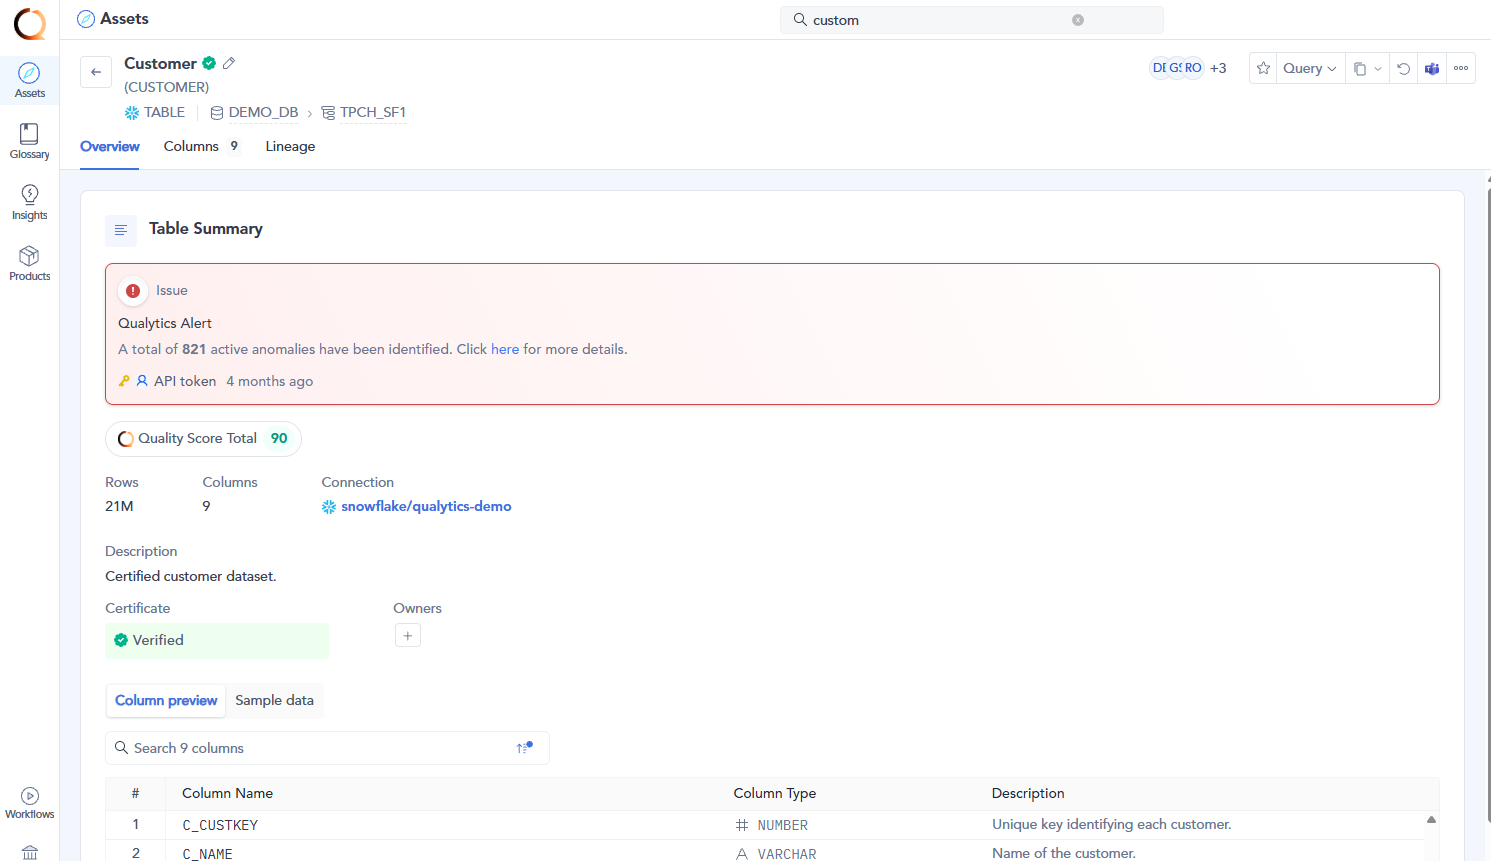
10. Catalog Integrations & Marketplace Apps
We expanded integrations with data catalogs and marketplace apps to ensure that data quality insights are readily available to users within their preferred data discovery and governance tools. This includes new integrations with Collibra, DataHub, and Microsoft Purview, as well as an expanded Atlan integration delivered through the Atlan Marketplace App.
These integrations enable you:
- Surface data quality scores, anomalies, and health indicators directly within your data catalog.
- Keep ownership, tags, and governance context aligned between Qualytics and cataloged assets.
- Enable business and data teams to assess trust and quality at the point of data discovery, not after issues occur.
Qualytics: Built for Today, Ready for What’s Next
The capabilities we delivered in 2025 make data quality easier to manage in real production environments. Teams can automate workflows, scale coverage without manual effort, understand how their data is changing over time, and surface data quality context directly where work happens.
Together, these features help data quality teams spend less time reacting to issues and more time maintaining consistent, trusted data across the organization. This applies whether teams are supporting AI, reporting, reconciliation, governance, or compliance use cases.
Start with the features most relevant to your use cases and build from there. Your account team can help you prioritize and roll them out.
Chapters
Related Articles
Qualytics Announces Technology Partnership With Databricks
Organizations can now run Qualytics natively on the Databricks Data Intelligence Platform, ensuring their data is accurate, explainable, and AI-ready without external processing.
Qualytics + Atlan
Integration announcement detailing Qualytics partnership with Atlan data catalog, enabling unified metadata management, quality monitoring, and collaborative data governance workflows.
How to Detect Table and Schema Changes in Snowflake Using Time Travel
This use case demonstrates how a Qualytics customer developed a lightweight monitoring process utilizing Snowflake Time Travel and Qualytics Quality Checks to surface data and schema changes within minutes, without requiring the addition of new pipelines or infrastructure.
Related News
Qualytics Announces Technology Partnership With Databricks
Organizations can now run Qualytics natively on the Databricks Data Intelligence Platform, ensuring their data is accurate, explainable, and AI-ready without external processing.
Qualytics + Atlan
Integration announcement detailing Qualytics partnership with Atlan data catalog, enabling unified metadata management, quality monitoring, and collaborative data governance workflows.
How to Detect Table and Schema Changes in Snowflake Using Time Travel
This use case demonstrates how a Qualytics customer developed a lightweight monitoring process utilizing Snowflake Time Travel and Qualytics Quality Checks to surface data and schema changes within minutes, without requiring the addition of new pipelines or infrastructure.