These notes catch up with several releases since our last published update on 2025.11.27 and are current as of the 2025.12.12 version of the platform.

Dec 12, 2025
2
min read
Table of Contents

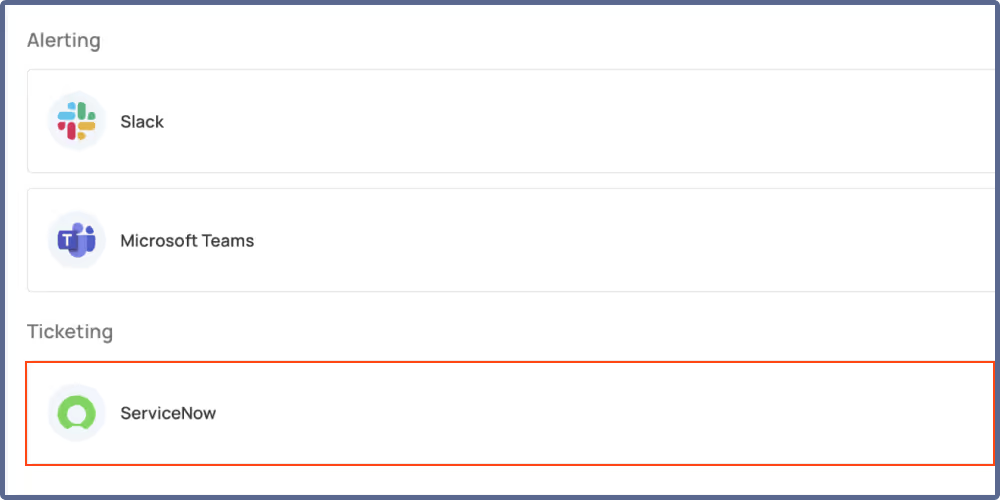
ServiceNow Ticketing System integration
You can now connect Qualytics with ServiceNow to streamline your anomaly management workflow through automated incident creation and tracking. Create ServiceNow incidents directly from anomalies with details populated automatically, and keep your teams in sync as anomaly status changes and comments are pushed to the linked incident as work notes—ensuring everyone stays informed without manual updates.
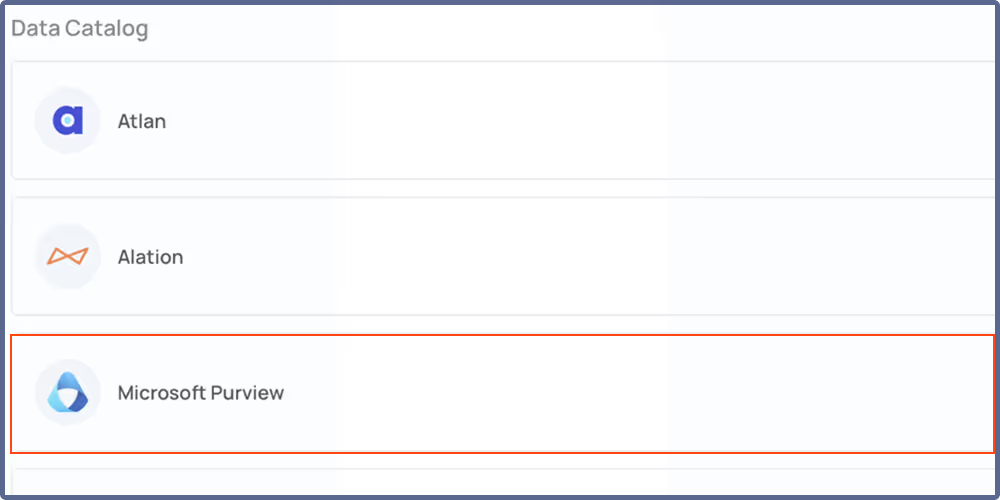
Microsoft Purview Data Catalog Integration
Connect Qualytics with Microsoft Purview to enrich your catalog assets with actionable data quality context. Import tags from Purview to keep your tagging and classification consistent, while quality scores, dimension breakdowns, active check counts, and anomaly counts are automatically published to corresponding Purview assets. Event-driven synchronization keeps everything up to date as scans complete, anomaly statuses change, checks are updated, and quality scores are recalculated—ensuring your data catalog always reflects the current state of your data quality.
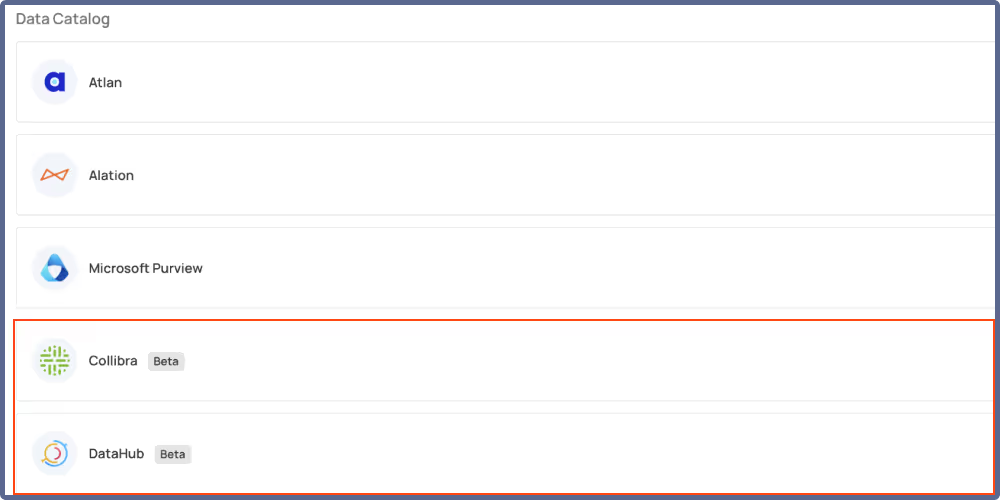
Collibra and DataHub Integrations (Beta)
Connect Qualytics with Collibra and DataHub to synchronize your data quality metadata across platforms. Import tags from your catalog provider to maintain consistent tagging, while quality scores, active check counts, and anomaly metrics are automatically published to corresponding catalog assets. Event-driven synchronization ensures your catalogs stay current as data quality events occur in Qualytics—keeping your entire data ecosystem aligned without manual intervention.
Enhanced Flows: Scheduling Support and Node Management
Flows now support a new scheduled trigger type alongside existing event-based options. Configure flows to run automatically at defined intervals using cron expressions—just like scheduling Catalog, Profile, and Scan operations. The flow list displays schedule information and next trigger times right away, so you always know when your scheduled flows will run.
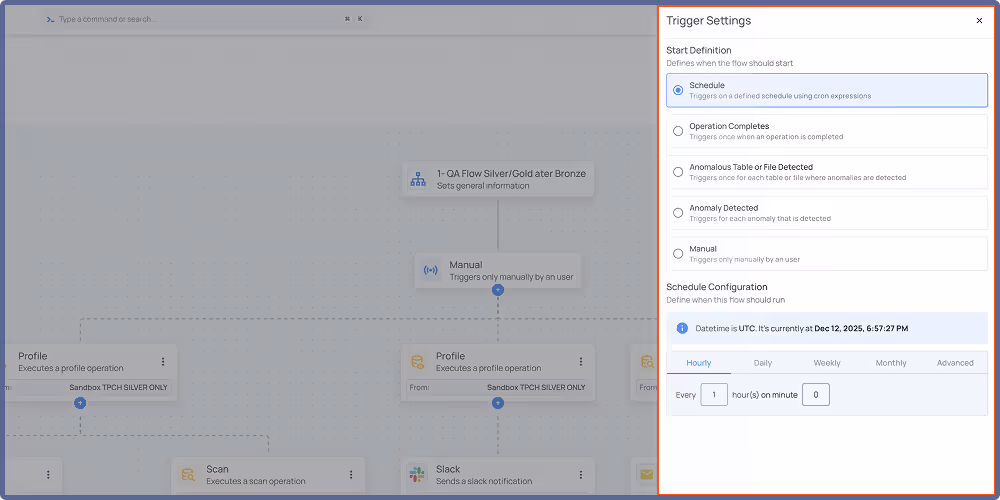
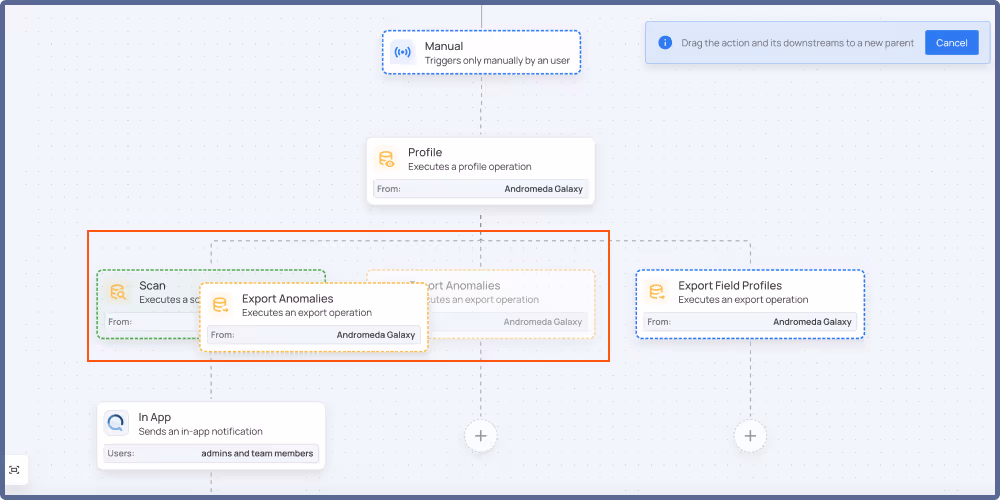
Rearranging your flow logic is now more intuitive with drag-and-drop node management—move action nodes and their descendants to a new parent, or swap a node’s position with its parent in a single click while maintaining your flow hierarchy. Visual feedback during rearrangement indicates valid and invalid drop targets, making flow editing faster and more intuitive.
General Fixes and Improvements
Fixes (10)
- Corrected sampling metrics in container profiles where records processed could exceed total record count, resulting in inaccurate percentage calculations.
- Adjusted the “Drop Suffix” option to be active by default in the Computed Field dialog.
- Addressed Snowflake permissions error affecting enrichment operations in JDBC datastores.
- Fixed quality score calculation that could produce negative accuracy values in certain conditions.
- Removed auto-activation in check activation dialog to prevent accidental activations.
- Corrected scan operations to properly report enrichment failures in operation results instead of showing success status.
- Resolved row count mismatch between Overview and Observability charts caused by timezone alignment issues.
- Fixed single-value
each()keyword not generating permutations correctly in check templates. - Cleared Delta Table metadata cache issue that persisted after container operations completed.
- Resolved connection verification failures not returning operation results to the Controlplane.
Improvements (13)
- Introduced Cast Type computed field for casting fields to different data types without writing raw expressions, with date format specification support for converting non-standard formats.
- Added filters by trigger type and deactivation status to the flow definitions page for easier flow discovery.
- Enabled bulk activate and deactivate actions for managing multiple flows efficiently.
- Incorporated Activate/Deactivate toggle to the Flow Settings panel for quicker access to flow status controls.
- Updated Scan Settings labels and descriptions that caused confusion about threshold behavior and scanning limits.
- Optimized materialize operation performance with enhanced partition calculation.
- Added Engine information on the Settings Status page, displaying the deployment engine (Kubernetes, or Databricks).
- Refined error messages for sync operation timeouts to better distinguish between Dataplane availability and datastore response issues.
- Added visual in-progress indicator to Data Volume Over Time charts when measurements are still being recorded for the current period.
- Included tooltip explanation on Data Volume charts indicating when current period measurements are still in progress.
- Enhanced Data Volume charts to display the previous period’s value as a placeholder when current period data is not yet available.
- Optimized scan performance by eliminating unnecessary data shuffling when applying record limits.
- Implemented bulk deactivate and activate actions for schedules within the datastore context.
As usual, our User Guide and accompanying Change Log captures more details about this release.