Data quality scores should tell you what's wrong, where it matters, and how to fix it. Here's why most data quality platforms fall short and how Qualytics gets it right.
Dec 2, 2025
8
min read
Table of Contents

A data quality score should help you decide whether you can trust your data, what’s affecting that trust, and where to focus first. Most tools answer only a fraction of that. They offer a single number that looks authoritative but leaves teams guessing about what it means, why it moved, or how to fix the underlying issues.
For data leaders trying to operationalize quality, that lack of clarity creates noise instead of insight. When a score drops from 94 to 87, does that signal a critical issue in a revenue field, or a minor problem in an optional, rarely used column? Without context, a score is just math, not guidance.
This is the gap Qualytics set out to solve. We rebuilt scoring around transparency, real-world usage, and context.
Where Generic Data Quality Scores Break Down
Most platforms fall into three traps that create noise instead of insight:
1. Simple averages - These systems score quality by averaging pass/fail results across all checks, giving every rule the same weight regardless of dataset importance or failure severity. This measures how many checks passed, not how much risk remains in the data.
Your score can look healthy while critical data is broken, because low-stakes checks drown out high-stakes failures. Teams get a false sense of safety and struggle to prioritize fixes.
2. Opaque algorithms - Some platforms blend signals like rule failures, freshness/SLA misses, volume anomalies, schema drift, and others into a proprietary score you can’t inspect. Hidden weights and thresholds mean you can’t see what changed or why.
Instead of triggering fast fixes, alerts lead to investigation of cause and severity, which slows down response times. Accountability becomes unclear, and controls are harder to defend.
3. One-size-fits-all measuring - Many tools mix data correctness with monitoring coverage, so teams are scored on how many checks they’ve built as much as on whether the data is right. That approach ignores context such as what fields are critical, how data is used downstream, and how big a failure’s blast radius is.
Early or lean teams can look “low quality” even when their core data is solid, while high-risk failures in key pipelines are underweighted. In analytics and AI, small upstream defects can quietly propagate into thousands of automated, unreliable decisions.
What a Useful Score Should Actually Tell You
A modern scoring model should help you navigate from the enterprise level to a single field in a few clicks. It should explain exactly what’s driving change and why it matters. To do that, a score needs five qualities:
- Granularity: You need to move fluidly from datastore to dataset to field. High-level scores aren’t helpful if you can’t drill down.
- Transparency: A score should be decomposable. You should know which dimensions changed and how strongly each one contributed.
- Context: Critical fields that power revenue, forecasting, or AI models shouldn’t be weighted the same as optional text columns.
- Actionability: A score should point to the owners, records, and workflows that can resolve the issue.
- Adaptiveness: As your data ecosystem changes, so should the way your score interprets it.
These are the principles that shaped the scoring model we built.
How Qualytics Scores Data Quality Differently
A multi-level scoring hierarchy
Qualytics calculates scores at three levels:
- Field (column)
- Container (tables, files, and other data assets)
- Datastore (databases, domains, and source systems)
This structure mirrors how teams think about data. Executives can zoom out to understand the health of a domain. Stewards can move directly to the tables that need attention. Engineers can pinpoint the exact records causing failures.
Most tools offer one score per dataset or database. Qualytics instead provides an ecosystem view that stays navigable as scale increases.
Eight measurable quality dimensions
Every score in Qualytics decomposes into eight factors. These factors mirror the foundations of the platform and are directly influenced by the checks running on your data.
- Completeness: Are values missing?
- Measures the average percentage of non-null values in a field throughout the measurement period. For example, if a "phone_number" field has values present in 90 out of 100 records, its completeness score for the measurement would be 90%.
- Coverage: Is the field being monitored enough?
- Measures the number of quality checks defined for monitoring the field's quality.
- Conformity: Does the data match required patterns?
- Measures how well the data adheres to specified formats, patterns, and business rules. For example, checking if dates follow the required format (YYYY-MM-DD) or if phone numbers match the expected pattern.
- Consistency: Is the data type uniform over time?
- Measures uniformity in type and scale across all data representations. Verifies that data maintains the same type and representation over time. For example, ensuring that a typed numeric column does not change over time to a string.
- Precision: Does the data meet resolution standards?
- Evaluates the resolution of field values against defined quality checks.
- Timeliness: Is the data arriving on schedule?
- Gauges data availability according to schedule.
- Volumetrics: Is the data size and shape consistent?
- Analyzes consistency in data size and shape over time.
- Accuracy: Does the value match real-world expectations?
- Determines the fidelity of field values to their real-world counterparts or expected values.
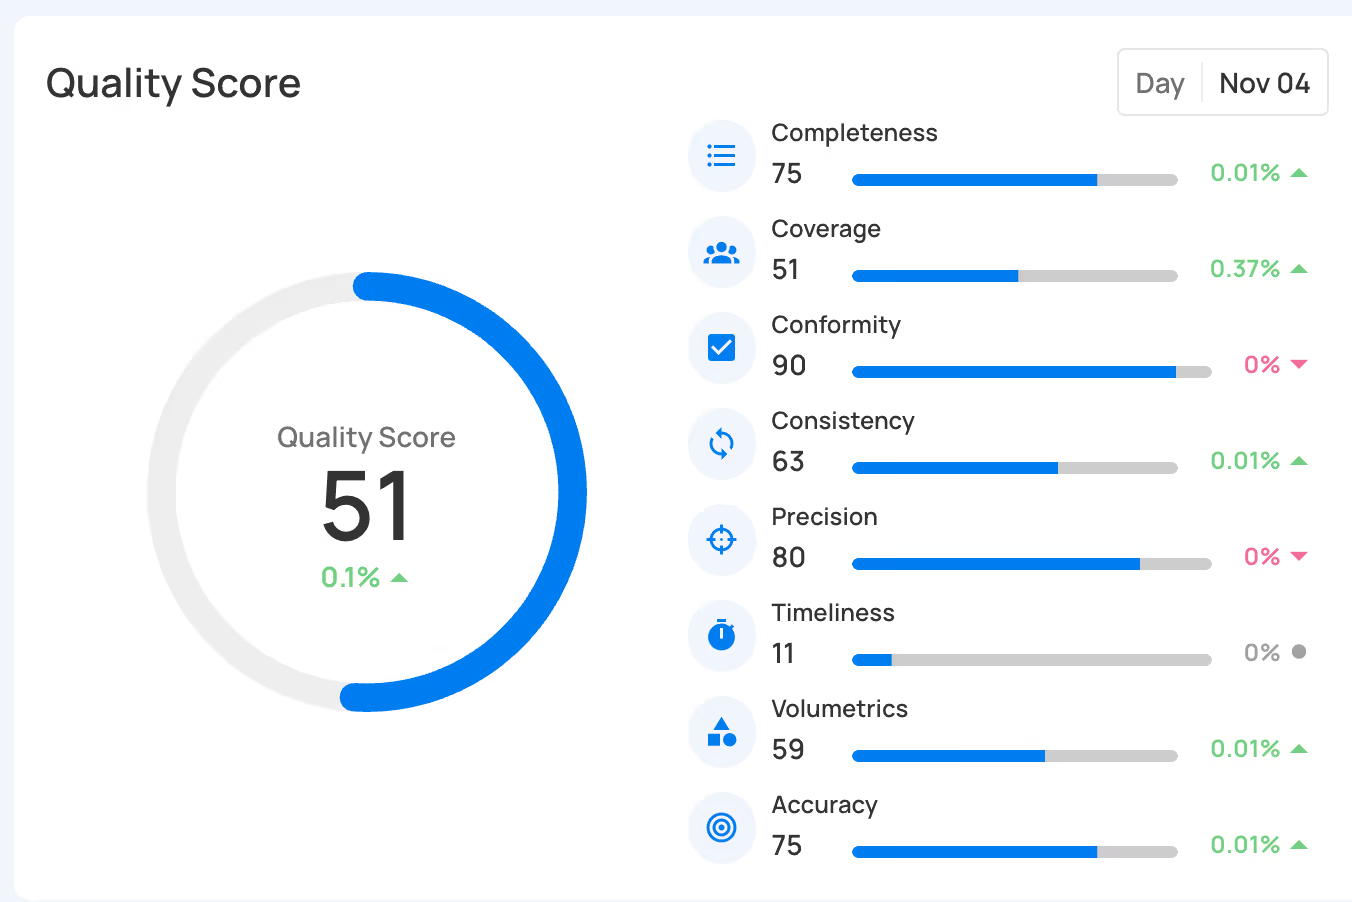
This means that when a score moves, you see the reason. Instead of an abstract “health” metric, you get a specific dimension tied to specific checks.
For example, a container dropping from 94 to 87 isn’t just a red number. You might see consistency fell 12 points due to a foreign key mismatch between customer and order tables. Everything else holds steady. You know exactly where to start.
Usage-aware weighting
Not all fields carry the same business impact. A typo in a notes field doesn’t compare to a null in a primary key.
Qualytics weights scores based on real usage patterns: which fields feed downstream systems, which reports depend on them, and which processes break when data shifts. This weighting adjusts over time as usage evolves.
Scoring factors are also customizable for each customer so you can choose the weighting that fits best for your data. This keeps scoring aligned to real business risk rather than an arbitrary equal-weight model.
Learning normal behavior, not just enforcing rules
Qualytics blends deterministic checks with machine learning that learns the shape of your data—its distributions, ranges, common formats, and relationships. When behavior drifts, the score reflects it, even without a predefined rule.
This catches:
- Schema drift
- Unexpected format changes
- Distribution shifts
- Seasonal pattern breaks
- Vendor inconsistencies
- Cross-system mismatches
Traditional tools only catch what you explicitly define. Qualytics catches what you expect, based on the data’s history.
What This Looks Like in Practice
Consider a common scenario: a vendor silently changes a date format from MM/DD/YYYY to DD/MM/YYYY. Pipelines don’t fail. The ingest completes. But the dates are wrong.
Most tools: The database-level score doesn’t change. There’s no alert. Teams only notice the issue when the end-of-month report looks off.
With Qualytics:
- The field-level score for transaction_date drops immediately.
- The container score reflects the change.
- An anomaly flags an unexpected pattern shift.
- The alert routes automatically to the owner of the vendor integration.
- Downstream processes at risk are highlighted.
The issue is identified and corrected in minutes—not discovered days later, after decisions have already been made. This is the difference between a score that informs action and a score that just records activity.
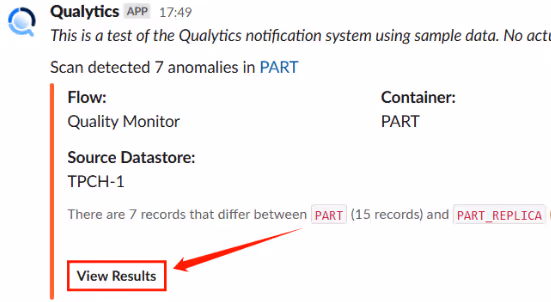
Turning Scores Into Action
A score alone doesn’t improve data quality. But it can accelerate the path from detection to resolution when it’s connected to the right workflows.
Qualytics uses scores to drive:
- Targeted alerts based on ownership and impact
- Context-rich anomaly investigation
- Priority scoring for remediation
- Automated or semi-automated correction flows
- Continuous learning that reduces false positives over time
Anomalies provide the evidence—failing records, trends, pattern changes. Scores provide the signal—where to start and what matters most.
Together, they shift teams from triage to preventative operations, and eventually toward automated remediation as maturity grows.
Why This Matters Now
Organizations have always cared about quality, but the stakes and the shape of the problem have changed. Data now powers automated decisions across analytics and AI, so a small upstream defect can cascade into thousands of downstream errors before a human ever notices. At the same time, data environments are more dynamic, with more sources, more transformations, and more consumers, making static, one-size-fits-all scoring and manual rule management impossible to sustain.
That’s why quality scores can’t just be pass-fail averages or black-box health metrics. Teams need scoring that is explainable, auditable, and grounded in business context, so they can see what changed, why it matters, and where to act first. In an automation-first world, the difference between a generic score and a context-aware one is the difference between finding issues after they damage decisions and preventing them before they spread.
Ready to move from check averages to context-aware quality scores?
Schedule a demo to see how Qualytics scores your data transparently, contextually, and aligned to how your business works.
Chapters
Related Articles

From Firefighting to Foresight: Building Trust Through Augmented Data Quality
Move from reactive cleanup to proactive trust. Here’s how augmented data quality empowers Chief Data Officers with trusted, AI-ready enterprise data.

How to Make the Business Case for Data Quality (Without Talking About Data Quality)
Learn how data leaders frame data quality as a business enabler by using AI, risk, and operations stories executives understand to justify investment and accelerate outcomes.

Chief Data Officer's Playbook for Data Quality
Comprehensive playbook for CDOs covering data quality strategy development, governance frameworks, team building, technology selection, and executive leadership best practices.
Related News
From Firefighting to Foresight: Building Trust Through Augmented Data Quality
Move from reactive cleanup to proactive trust. Here’s how augmented data quality empowers Chief Data Officers with trusted, AI-ready enterprise data.
How to Make the Business Case for Data Quality (Without Talking About Data Quality)
Learn how data leaders frame data quality as a business enabler by using AI, risk, and operations stories executives understand to justify investment and accelerate outcomes.
Chief Data Officer's Playbook for Data Quality
Comprehensive playbook for CDOs covering data quality strategy development, governance frameworks, team building, technology selection, and executive leadership best practices.
Discover More From Qualytics.
Join the companies using Qualytics to make data quality proactive, automated, and shared across business and data teams.